

CalEnviroScreen Logo

CalEnviroScreen

CalEnviroScreen 5.0

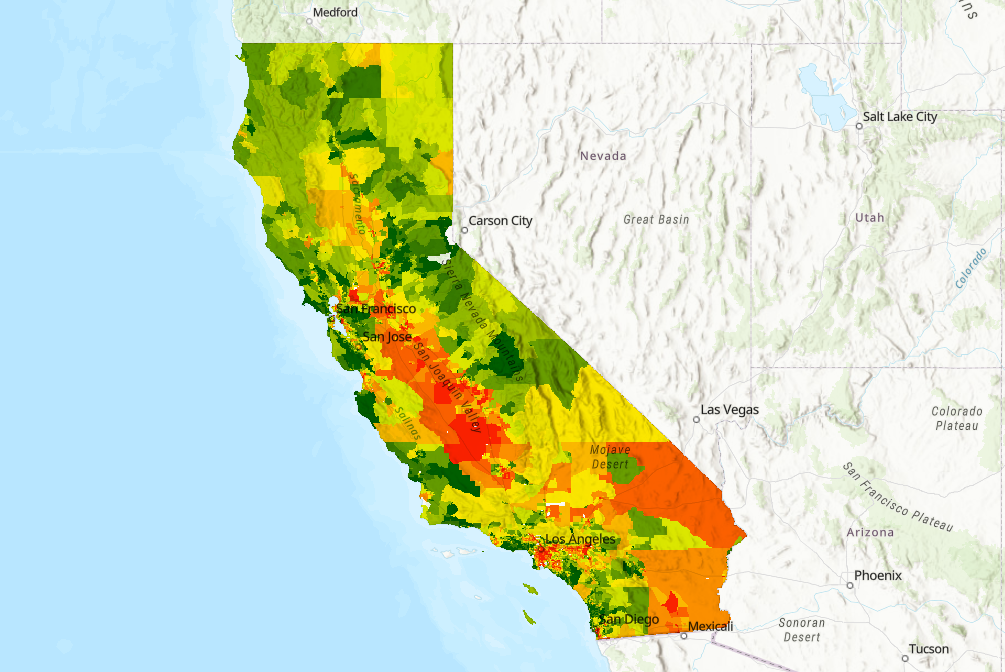
Explore how communities in your area may be disproportionately burdened by multiple sources of pollution in CalEnviroScreen 5.0.
View the Map


Contact Us

Didn’t find what you were looking for? Check out our FAQ page. You can also leave us a message using the form below or email us directly at CalEnviroScreen@oehha.ca.gov

View the CalEnviroScreen Contact Us page

Reports, Notices, Documents

CalEnviroScreen indicator overview page for the cardiovascular disease indicator
: Maps & Data

New CalEnviroScreen 4.0 data dashboard released. The dashboard is an interactive online tool used for filtering and visualizing the latest CalEnviroScreen data. Users can filter CalEnviroScreen 4.0 data by geography (county, city, or legislative district) and by any combination of the results from the 21 indicators. A tutorial video and user guide are available.

: Model & Scoring

Information on how CalEnviroscreen uses pollution burden and population characteristics to calculate the CalEnviroscreen score.

: Sobre CalEnviroScreen

Vea el nuevo StoryMap en español que conmemora los 10 años de la primera versión pública de CalEnviroScreen. El StoryMap muestra cómo se desarrolló CalEnviroScreen, se ha mejorado con el paso de tiempo, ha sido utilizado para promover la justicia ambiental y cómo se ha convertido en un modelo nacional.

The US EPA and OEHHA are hosting two joint virtual trainings on CalEnviroScreen and EJScreen for community members and non-profit organizations interested in using environmental justice (EJ) data tools in grant applications.