Model & Scoring
What is the CalEnviroScreen Model?
The CalEnviroScreen model is based on CalEPA's definition of cumulative impacts:
Cumulative impacts means exposures, public health or environmental effects from the combined emissions and discharges, in a geographic area, including environmental pollution from all sources, whether single or multi-media, routinely, accidentally, or otherwise released. Impacts will take into account sensitive populations and socioeconomic factors, where applicable and to the extent data are available.
–CalEPA, 2005
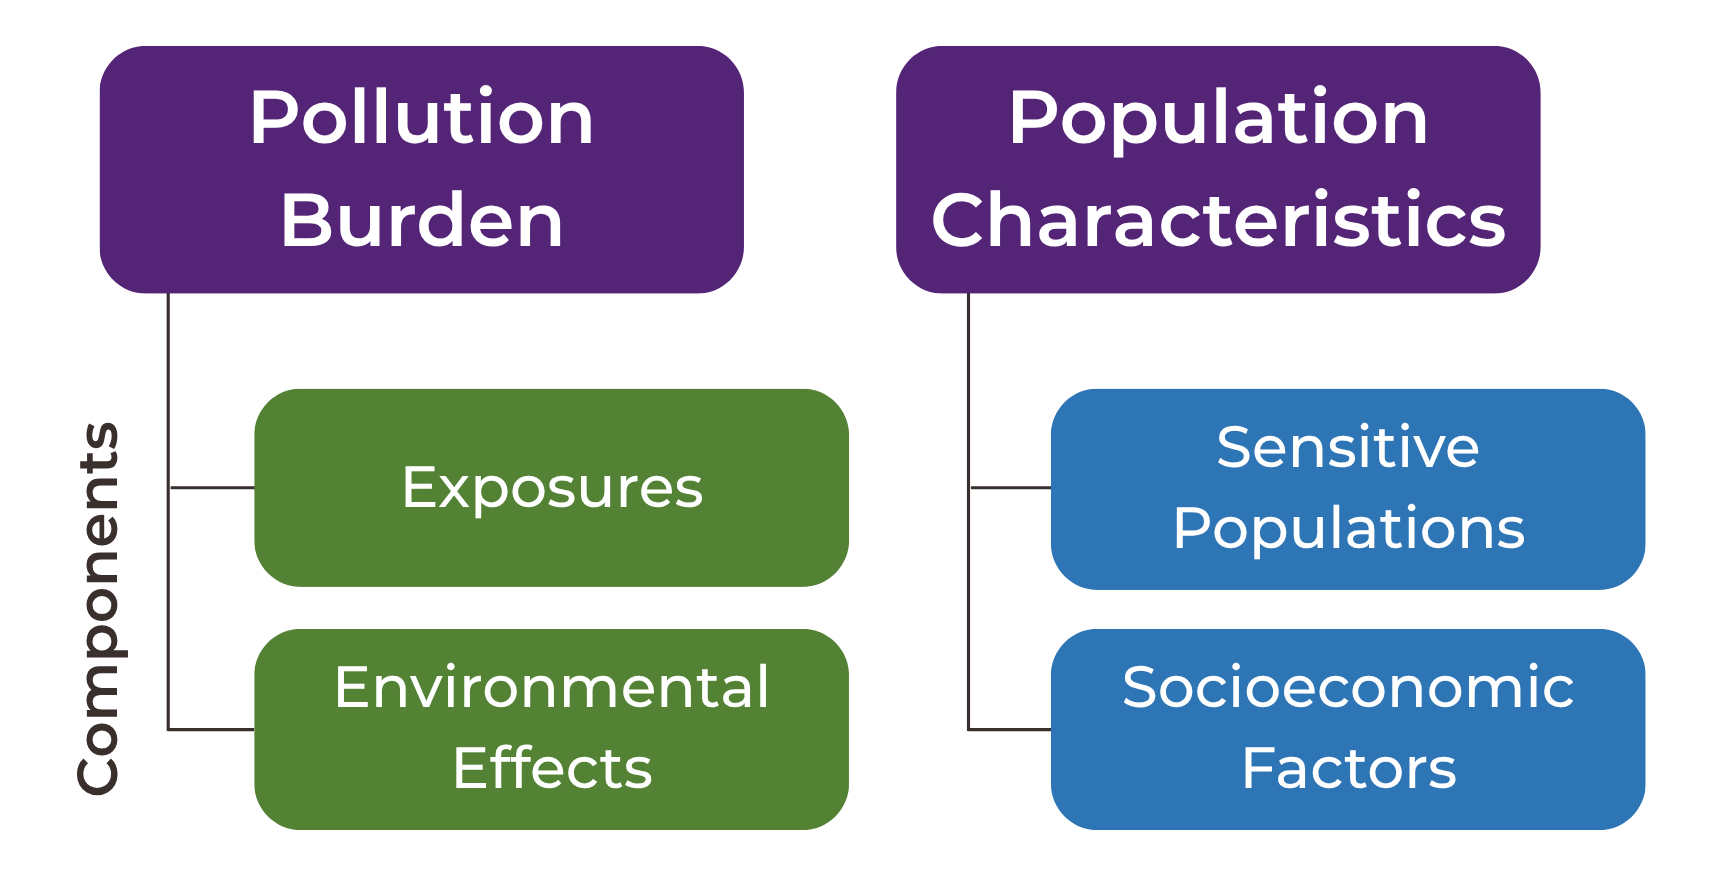
To evaluate these cumulative impacts statewide, OEHHA uses a model made up of four components. There are two Pollution Burden (Exposures and Environmental Effects) and two Population Characteristics (Sensitive Populations and Socioeconomic Factors) components in CalEnviroScreen.
- Each component is made up of a set of indicators that help to describe pollution burden or the factors that make communities more vulnerable to the effects of pollution.
- There are 14 Pollution Burden indicators and 9 Population Characteristics indicators in CalEnviroScreen 5.0.
How are communities represented geographically?
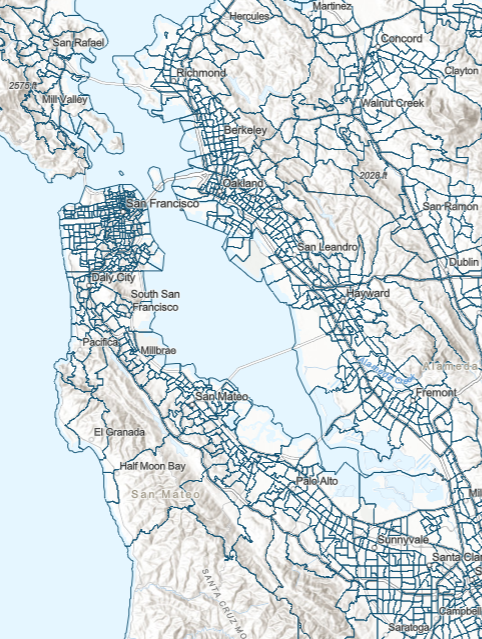
The CalEnviroScreen model is based on geography, specifically, census tracts in California. Census tracts are small, fixed areas defined by the U.S. Census Bureau that are useful for representing communities and combining, organizing, and mapping data.
CalEnviroScreen 5.0 uses census tract boundaries from the 2020 U.S. Census.
- Boundaries often follow visible features or landmarks in a community, such as roads or rivers.
- Census tracts usually contain around 4,000 people.
- There are about 9,100 census tracts in California.
How is CalEnviroScreen scored?
Each census tract receives scores for as many of the 23 CalEnviroScreen indicators as possible. Some census tracts will not have scores for every indicator due to data gaps.
Once scores are identified for individual indicators, they are combined into a single index through the following steps:
- For each indicator, individual census tract scores are ranked from highest to lowest, allowing a percentile to be calculated for each indicator score for every census tract.
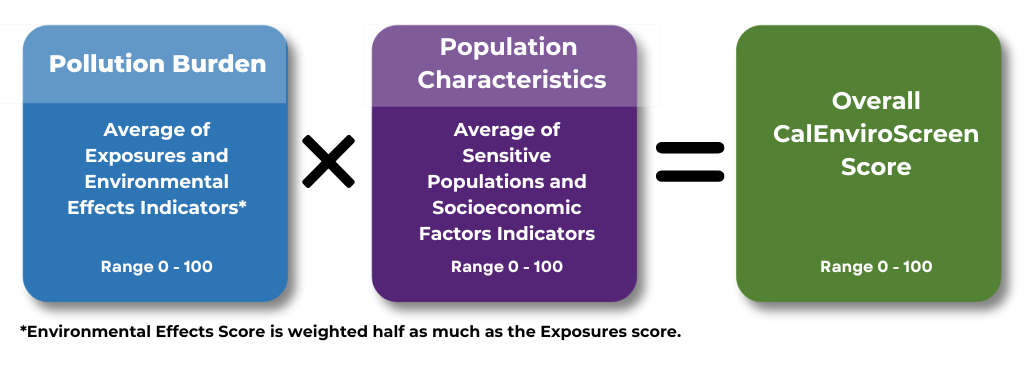
- Using these indicator percentiles, an average score is calculated for each of the four components: Exposures, Environmental Effects, Sensitive Populations, and Socioeconomic Factors.
- A census tract's Population Characteristics score is calculated as the average of its two component scores — Sensitive Populations and Socioeconomic Factors.
- A census tract's Pollution Burden score is calculated as the average of its two component scores — Exposures and Environmental Effects. The Environmental Effects component is weighted one-half because Environmental Effects make a smaller contribution to Pollution Burden than Exposures do.
- To get the final CalEnviroScreen score for a census tract, the Pollution Burden score is multiplied by the Population Characteristics score.
- Final CalEnviroScreen scores for all census tracts across the state are ranked from highest to lowest, producing a percentile between 0 and 100 for each census tract.
Technical Report
Complete documentation of the CalEnviroScreen 5.0 model, scoring methodology, indicator rationale, and more is available in the full technical report.