CalEnviroScreen 4.0
CalEnviroScreen 5.0 is the latest version of the tool. | Learn more
CalEnviroScreen 4.0 was released in October 2021. CalEnviroScreen is a screening methodology that can be used to help identify California communities that are disproportionately burdened by multiple sources of pollution.
See our StoryMap Commemorating 10 Years of CalEnviroScreen (May 2023)
CalEnviroScreen 4.0 Report and Documents:
- CalEnviroScreen 4.0 Report
- Summary of Changes in CalEnviroScreen 4.0
- CalEnviroScreen 4.0 Press Release
- Comunicado de Prensa de CalEnviroScreen 4.0
- Responses to Major Comments on the CalEnviroScreen 4.0 Draft
The draft CalEnviroScreen 4.0 was released for public comment from February 19 to May 14, 2021. OEHHA convened a webinar and six workshops on the draft CalEnviroScreen 4.0 for the public to learn about the updates and provide public comment on the draft. Visit the workshop and public comment page to view the workshop summaries and public comments received on the draft.
See also CalEPA's 2022 SB 535 Identification of Disadvantaged Communities using CalEnviroScreen 4.0. More information is available on OEHHA's SB 535 page.
Mapping Tools
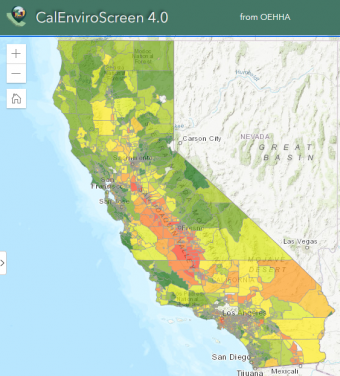
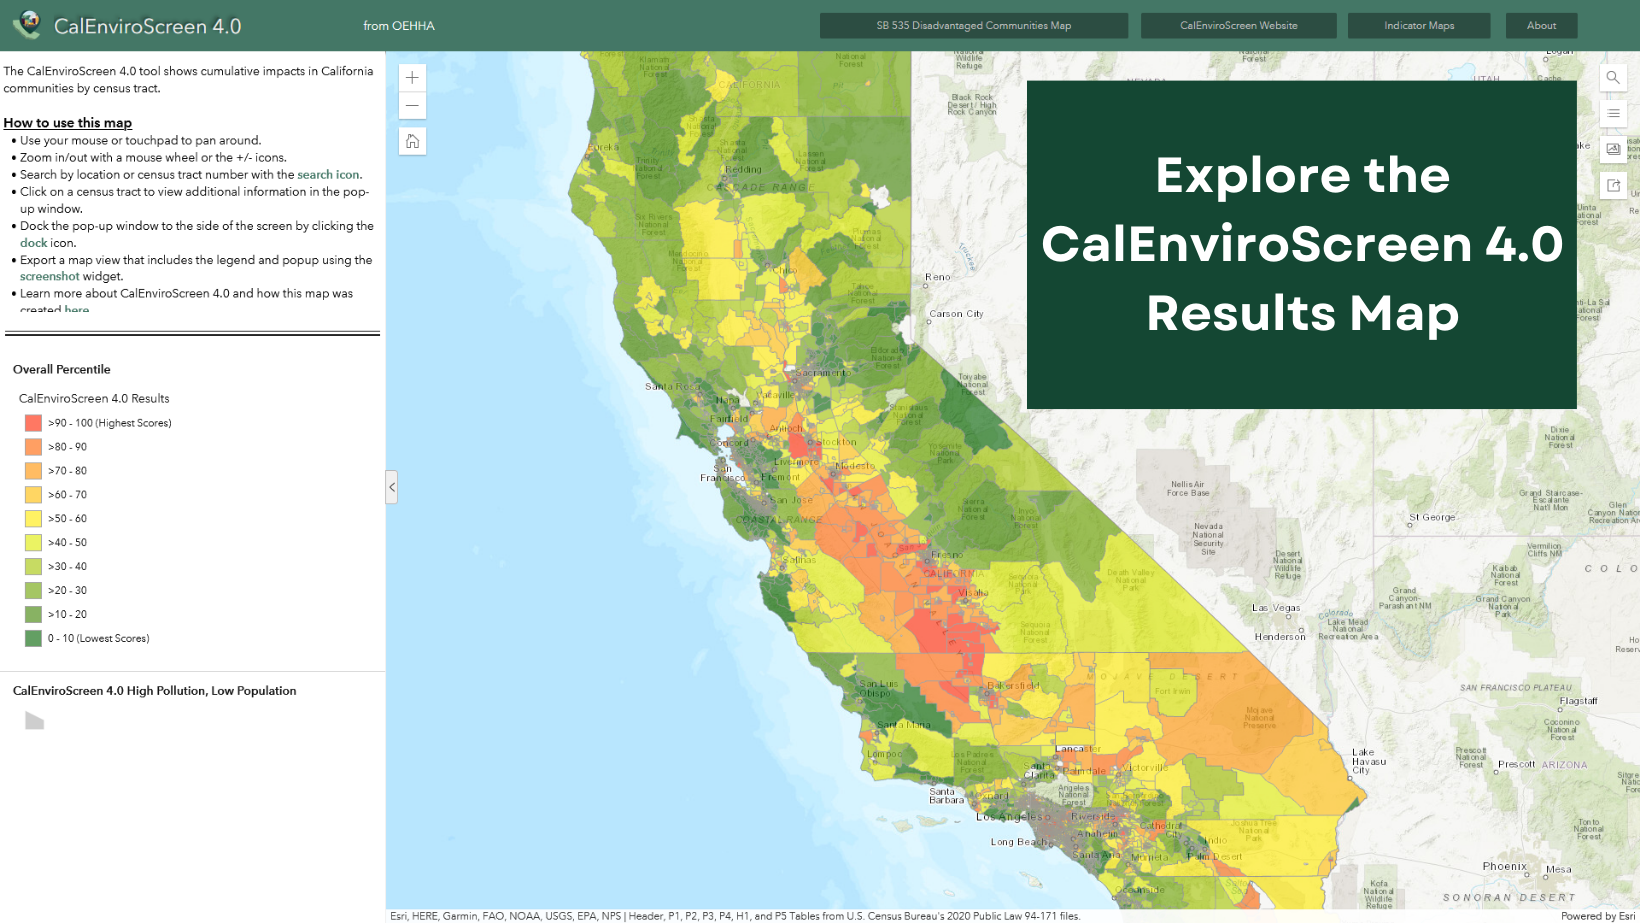
Map of CalEnviroScreen 4.0 Results. Click to open in a new window. [En Español aquí]
Map of CalEnviroScreen 4.0 Indicators. Click to open in a new window.


CalEnviroScreen 4.0 Data Dashboard
The dashboard is an interactive online tool used for filtering and visualizing the latest CalEnviroScreen data. Users can filter CalEnviroScreen 4.0 data by geography (county, city, or legislative district) and by any combination of the results from the 21 CalEnviroScreen indicators. The dashboard can be accessed on its own or through the user guide. A tutorial video is also available.
- CalEnviroScreen 4.0 Data Dashboard
- Dashboard User Guide
- Dashboard Tutorial Video
- Using CalEnviroScreen and EJScreen: CalEnviroScreen Training Materials
- Utilizando CalEnviroScreen y EJScreen: Materiales de Capacitación de CalEnviroScreen
Analysis and StoryMap on Race/Ethnicity and CalEnviroScreen 4.0 Results
 Understanding the role that race/ethnicity plays in the context of pollution burdens and vulnerabilities remains an important part of this work.
A analysis of the CalEnviroScreen 4.0 results by race/ethnicity is available with an accompanying StoryMap. OEHHA plans to release a more extensive analysis of data on race/ethnicity and age with the CalEnviroScreen 4.0 results in the future.
- Analysis of Race/Ethnicity and CalEnviroScreen 4.0
- StoryMap on the Analysis of Race/Ethnicity and CalEnviroScreen 4.0
 Hub Website
Also see the CalEnviroScreen Hub website, where you can find data, maps, supplemental analyses and other information on CalEnviroScreen 4.0 as it is released.
Data and Additional Materials
- Microsoft Excel spreadsheet and PDF with a Data Dictionary: There are two files in this zipped folder. 1) a spreadsheet showing raw data and calculated percentiles for individual indicators and combined CalEnviroScreen scores for individual census tracts with additional demographic information. 2) a pdf document including the data dictionary and information on zeros and missing values: CalEnviroScreen 4.0 Excel and Data Dictionary PDF
- ArcGIS Geodatabase: Includes CalEnviroScreen 4.0 results by census tract. Additional information describing the data and its limitations is part of the geodatabase (metadata). A zipped file which can be unzipped, then opened using ArcGIS software to view the results in a File Geodatabase Feature Class format (ArcGIS is a paid subscription): CalEnviroScreen 4.0 GDB file
- Shapefile: Includes CalEnviroScreen 4.0 results by census tract. Additional information describing the data and its limitations is part of the shapefile (metadata). Zipped file can be unzipped, and then opened in any GIS software: CalEnviroScreen 4.0 SHP file
- Service URL: ArcGIS feature service: https://services1.arcgis.com/PCHfdHz4GlDNAhBb/arcgis/rest/services/CalEnviroScreen_4_0_Results_/FeatureServer
For questions, please contact CalEnviroScreen@oehha.ca.gov or (916) 324-7572.
Downloads