The Earth has warmed at an unprecedented rate since the Industrial Revolution. Scientists attribute most of the warming since the 1950s to increased global levels of greenhouse gases in the atmosphere. These gases warm the Earth’s surface by trapping the sun’s heat. They include carbon dioxide (CO2), methane, nitrous oxide, and fluorinated gases. Methane and certain fluorinated gases are also considered “short-lived climate pollutants”; they remain in the atmosphere for shorter periods of time than CO2 but are more powerful warming agents. The burning of fossil fuel for energy is the largest source of greenhouse gas emissions. Other sources include landfills, water treatment facilities and livestock operations.
California’s pioneering efforts in the adoption and implementation of policies designed to curb greenhouse gas emissions have contributed to decreases in emissions statewide in recent years, even as California experienced population and economic growth. Emission reductions are critical in stabilizing atmospheric greenhouse gas concentrations to prevent “dangerous anthropogenic interference with the climate system.” To reduce the risks and impacts of climate change, the 2015 Paris Agreement aims to limit global warming to well below two degrees Celsius (°C) above pre-industrial levels and to pursue efforts to further limit this increase to 1.5°C.
What does the indicator show?
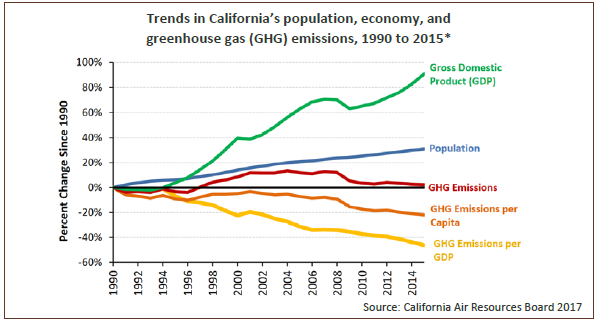
California’s 2015 greenhouse gas emissions are 10 percent lower than in 2004, when levels peaked. Between 1990 and 2015, emissions per capita declined by 22 percent, and emissions per dollar of gross domestic product (GDP, a measure of the state’s economic output) by 46 percent. During the same period, the state’s population and GDP increased by 31 percent and 91 percent, respectively.*
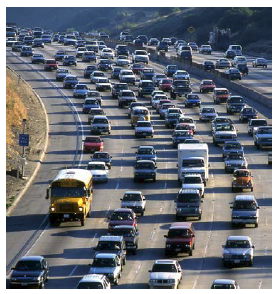
CO2 accounted for 84 percent of total greenhouse gas emissions, while methane and nitrous oxide made up nine and three percent, respectively. The transportation sector is the largest source, accounting for 37 percent of total 2015 emissions.
Why is this indicator important?
Emissions of greenhouse gases from human activities have dramatically increased their concentrations in the atmosphere. Emission reduction targets are set at levels intended to prevent these concentrations from reaching dangerous levels.
California continues to be an international leader in reducing greenhouse gas emissions. It established the nation’s first comprehensive program of regulatory and market mechanisms to achieve real, quantifiable, cost-effective greenhouse gas reductions with the passage of the California Global Warming Solutions Act of 2006 (also known as AB 32). This law required the reduction of greenhouse gas emissions to 1990 levels by 2020. (Statewide emissions fell below this target in 2016.) Laws passed in 2016 set additional emission reduction targets by 2030, namely 40 percent below the 1990 level for greenhouse gases, and specific targets relative to 2013 levels for the short-lived climate pollutants methane, hydrofluorocarbon gases and black carbon.
Emissions of CO2, the main contributor to climate change, stay in the atmosphere for hundreds of years. Reducing CO2 emissions is critically important but will not result in near-term cooling. Compared to CO2, short-lived climate pollutants are more powerful warming agents and remain in the atmosphere from days to decades. Therefore, reducing these emissions can have more immediate effects in slowing the rate of warming.
Accurately tracking emission trends in California provides critical information to policymakers for tracking the progress of greenhouse gas emission reduction programs and for assessing options to address climate change.
_______________
* Data for 2016, which became available after the release of the Indicators of Climate Change in California report, showed that California’s greenhouse gas emissions were three percent lower than 2015 levels that year, putting total emissions just below the 2020 target (1990 levels). For additional information, see: https://ww2.arb.ca.gov/news/climate-pollutants-fall-below-1990-levels-first-time
For more information about this and other climate change indicators, visit:
https://oehha.ca.gov/climate-change/report/2018-report-indicators-climate-change-california