Sea level rise
Sea levels have generally risen along the California coast over the past century.
Sea levels have generally risen along the California coast over the past century.
Global sea level rise is the most obvious manifestation of climate change in the ocean. As ocean waters warm with increasing air temperatures, water expands, and sea levels rise. Heat-driven expansion of ocean water accounts for about half of the global sea level rise in the past century. The other major contributor to sea level rise is water from melting ice caps, polar ice sheets and mountain glaciers. Sea levels have generally risen along the California coast, consistent with global observations.
Rising sea levels threaten California’s coastline communities and ecosystems. More than 70 percent of California’s residents live and work in coastal counties, where almost 86 percent of the state’s total gross domestic product is generated.
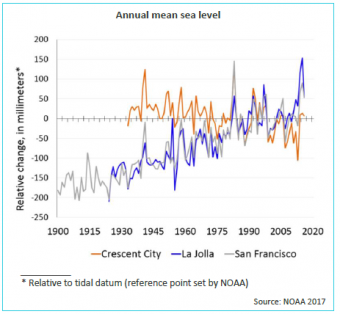
What does this indicator show?
The exception occurs at Crescent City, where sea level has dropped by about 70 mm (3 inches) since 1933. In this region, the uplift of land due to geological processes is producing opposing sea level trends. Local sea levels measured at tide gauges reflect the combined effects of regional sea level change and vertical land movement. At Crescent City, uplift of land is occurring at a faster rate than regional sea level rise. The net result is a decrease in local sea level. In contrast, at North Spit in nearby Humboldt Bay (about 70 miles south of Crescent City) where land is subsiding, the highest rate of sea level rise in California has been recorded.
Sea levels generally peak during years when El Niño conditions cause the waters of the eastern Pacific Ocean to warm. Levels at all three locations on the graph rose in 2014 and 2015, possibly due to unusually warm sea surface temperatures in the Pacific Ocean during that period (during the marine heat wave nicknamed the “warm blob”).
Why is this indicator important?
California’s hundreds of miles of scenic coastline contain expansive urban centers, ecologically fragile estuaries, and fisheries that would be impacted by changes in sea level. Natural gas lines, power plants, waste water treatment plants and other critical infrastructure in coastal areas are increasingly more vulnerable to the impacts of rising sea levels. Other concerns posed by rising sea levels are:

For more information about this and other climate change indicators, visit:
https://oehha.ca.gov/climate-change/report/2018-report-indicators-climate-change-california