
OEHHA's Analysis of California Climate Investments
[Shown below are the analysis results; methods paper coming soon]
This work complements the 2026 Annual Report to the Legislature on California Climate Investments Using Cap-and-Invest Auction Proceeds, available from the California Air Resources Board. OEHHA’s analysis focuses on the benefits and impacts of PM2.5 emission reductions due to California Climate Investments programs.
Priority populations and communities of color are on track to benefit most from PM2.5 emission reductions and associated avoided mortality.
Benefits to Californians from PM2.5 emission reductions

Across all reported projects, over three-fourths of the total expected PM2.5 emission reductions from California Climate Investments projects are occurring in priority populations. These include disadvantaged communities and low-income communities and households as defined in Senate Bill (SB) 535 (De León, Chapter 830, Statutes of 2012) and AB 1550 (Gomez, Chapter 369, Statutes of 2016). See CARB’s webpage on Priority Populations for more information.

Additionally, the majority of PM2.5 emission reductions are expected to benefit people of color throughout the state. In comparison to statewide distributions, the percentage for White Californians is greater than their statewide population percentage (44% of reductions compared to 37% statewide population in the 2019 American Community Survey). In contrast, the percentages for Hispanic Californians and Asian/Pacific Islanders are less than their statewide population percentages (36% of reductions compared to 39% statewide population for Hispanic Californians; 9% of reductions compared to 15% statewide population for Asian/Pacific Islanders).
Benefits to Californians from reduced premature all-cause mortality

Across the state, priority populations are estimated to receive about 85% of the avoided premature all-cause mortality benefits from California Climate Investments projects. This is estimated by modeling how many premature deaths might be prevented because people are breathing in less PM2.5.

People of color are estimated to receive close to half of the avoided premature mortality benefits. The benefit percentages for most groups are similar to their statewide population proportions from the 2019 American Community Survey with the exception of Hispanic Californians (23.4% benefits; 39% statewide population) and White Californians (53% benefits; 37% statewide population). Some of this may be attributable to age-related population characteristics.
There are important regional differences in cumulative PM2.5 emission reductions attributable to California Climate Investments
California’s census tracts with the top 25% of CalEnviroScreen 4.0 PM2.5 indicator scores primarily fall in two main areas: the Central Valley and the greater Los Angeles area; these areas contain almost 99% of tracts with high PM2.5 burden. Our analysis showed that many projects with estimated PM2.5 emission reductions have occurred in high PM2.5 burden areas of the Central Valley.
PM2.5 emission reductions in the Central Valley
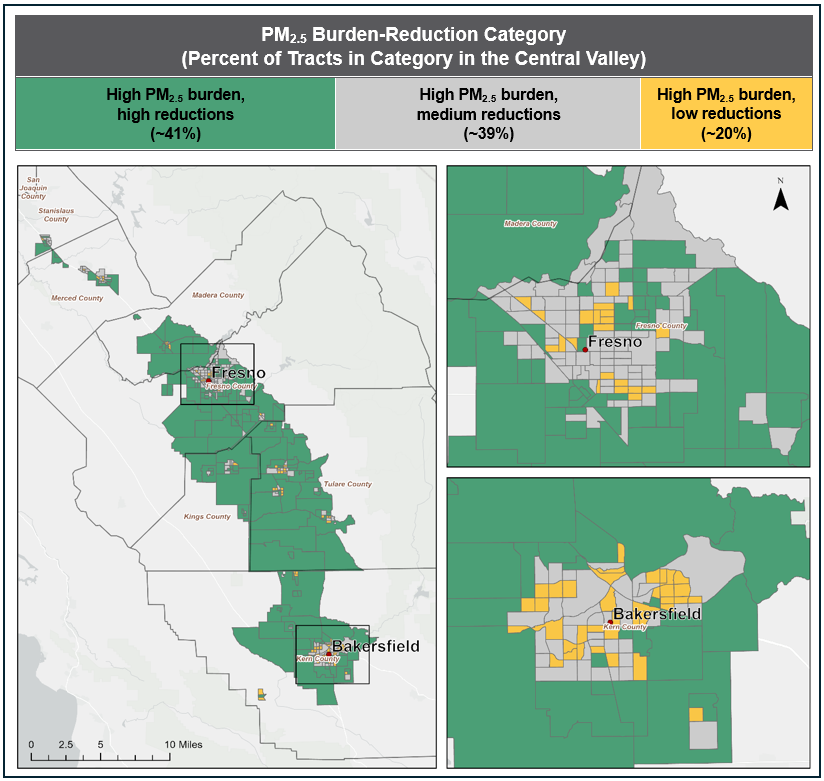
The map above shows that over 40% of high PM2.5 burden census tracts have high estimated PM2.5 emission reductions from California Climate Investments; this represents over 92% of the land area in square miles with a population of almost 1.2 million people. Rural census tracts in the Central Valley have benefited more from projects estimated to reduce PM2.5. Around 20% of high burden tracts have low estimated reductions (around 2% of the land area in square miles with a population of around 392,000 people).
PM2.5 emission reductions in the greater Los Angeles area
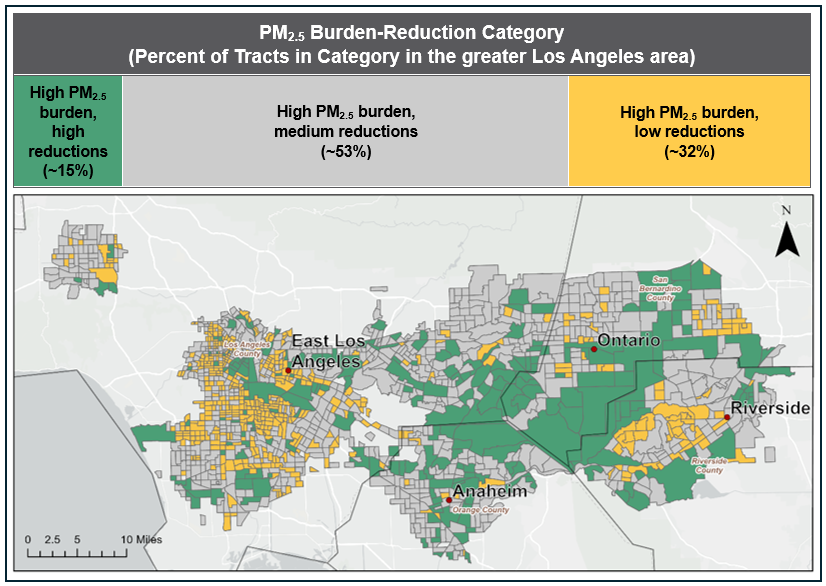
The map of the greater Los Angeles area above shows that there are around 15% of high PM2.5 burden census tracts associated with high estimated PM2.5 emission reductions due to California Climate Investments (about 35% of the land area in square miles with a population of around 1.3 million people). About one-third of census tracts in the greater Los Angeles area fall into the high PM2.5 burden, low reduction category (about 14% of the land area in square miles with a population of almost 2 million people).
In our analysis, we note that the estimated reductions are approximate and based on reported California Climate Investments project locations. There is also some uncertainty stemming from the fact that air pollution levels and reductions don’t perfectly align with geographical boundaries.