Atmospheric Greenhouse Gas Concentrations

Credit: aabejon/Getty Images Signature
Rising global temperatures are directly linked to increased concentrations of greenhouse gases in the atmosphere. These gases – which include carbon dioxide, methane, nitrous oxide, and fluorinated gases – warm the Earth’s surface by trapping heat. For more information, download the Atmospheric Greenhouse Gas Concentrations chapter.
What does the indicator show?
Monthly average atmospheric carbon dioxide concentrations
The graph shows monthly average atmospheric carbon dioxide concentrations measured in parts per million at four locations: (1) Mauna Loa, Hawaii (1958-2024); (2) La Jolla (1957-2024); (3) Point Arena (1999-2011); (4) Trinidad Head (2002-2017).
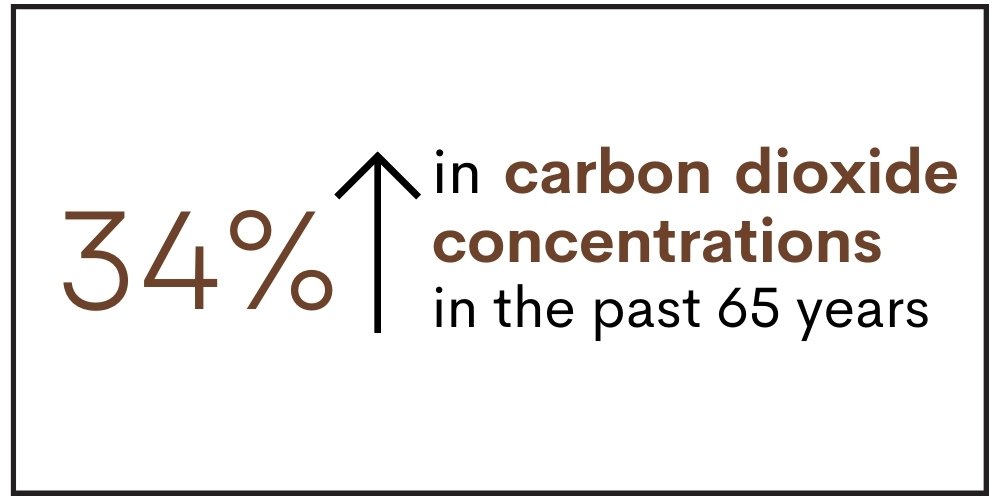
- Carbon dioxide concentrations at the global background site at Mauna Loa, Hawaii have increased from an annual average of 315 parts per million (ppm) in 1958 to 425 ppm in 2024. In the last five years, the yearly increase in carbon dioxide levels accelerated to about 2.5 ppm per year from an average rate of 1.6 ppm per year over the past 6 decades.
- Concentrations decrease in the spring through late summer as plants take up carbon dioxide and increase in autumn through late winter as they decay and release the gas.
- Since carbon dioxide levels tend to increase as one moves north from the equator, levels at the California sites are slightly higher than those at Mauna Loa.
- Atmospheric concentrations of methane and nitrous oxide also continue to increase globally and in California. Atmospheric concentrations of fluorinated gases, synthetic chemicals used as refrigerants and propellants, show mixed trends.
Why is this indicator important?
- The buildup of carbon dioxide in the Earth’s atmosphere has led to unprecedented warming. Levels of carbon dioxide, estimated to be about 280 ppm around the Industrial Revolution, reached 400 ppm in 2015 and have continued to increase. Since carbon dioxide remains in the atmosphere for centuries, atmospheric levels can remain high for some time, even if emissions decline or stop altogether.
- Tracking levels of greenhouse gases in the atmosphere helps inform policies and strategies needed to stabilize atmospheric concentrations to reduce the likelihood of catastrophic climate change.
What factors influence this indicator?
- The concentrations of greenhouse gases in the atmosphere reflect the difference between their emission and removal rates.
- Human activities lead to emissions, while natural processes either remove or release greenhouse gases. International, national, and state regulations affect greenhouse gas uses, emissions, and eventual atmospheric concentrations.
The global distribution and seasonal variation of carbon dioxide concentrations in the atmosphere from 2002 to 2022 is shown. Carbon dioxide concentrations continually increase over time (color changes from light yellow to red), while seasonal variation – governed by the growth cycle of plants – is evident each year in the northern hemisphere.
Additional resources:
- California Air Resources Board, Statewide Greenhouse Gas Monitoring Network
- National Oceanic and Atmospheric Administration (NOAA), The NOAA Annual Greenhouse Gas Index
- National Oceanic and Atmospheric Administration (NOAA), Trends in Atmospheric Greenhouse gases (Carbon Dioxide, Methane, Nitrous Oxide and Sulfur hexafluoride)
- Scripps Institution of Oceanography, Scripps CO2 Program
- United States Environmental Protection Agency (USEPA), USEPA Climate Change Indicators, Greenhouse Gases
- US Global Change Research Program, Annual Greenhouse Gas Index