

Greenhouse Gas Emissions

Credit: tibu/Getty Images Pro
Since the Industrial Revolution, greenhouse gas emissions released into the atmosphere from the burning of fossil fuels have warmed the Earth at an unprecedented rate. These gases warm the Earth’s surface by trapping the sun’s heat. They include carbon dioxide, methane, nitrous oxide, and fluorinated gases. In California, estimates of greenhouse gas emissions from human activities are tracked by the state’s greenhouse gas inventory. For more information, download the Greenhouse Gas Emissions chapter.
What does the indicator show?
Annual statewide greenhouse gas emissions, 2000-2022
Annual total emissions are measured in million metric tons of carbon equivalents from 2000 to 2022.
- Annual statewide greenhouse gas emissions peaked in 2004 and have generally been declining since. California reached its goal of reducing statewide emissions to below 1990 levels by 2016, four years ahead of schedule. Emissions have remained below this target since.
- Greenhouses gases include carbon dioxide, methane, nitrous oxide, and high global warming potential gases, which include gases that contain fluorine (or F-gases) used in refrigeration, air conditioning and foams. In 2022, carbon dioxide made up 81 percent of total emissions while methane accounted for 10 percent, nitrous oxide 3 percent, and fluorinated gases accounted for the rest.
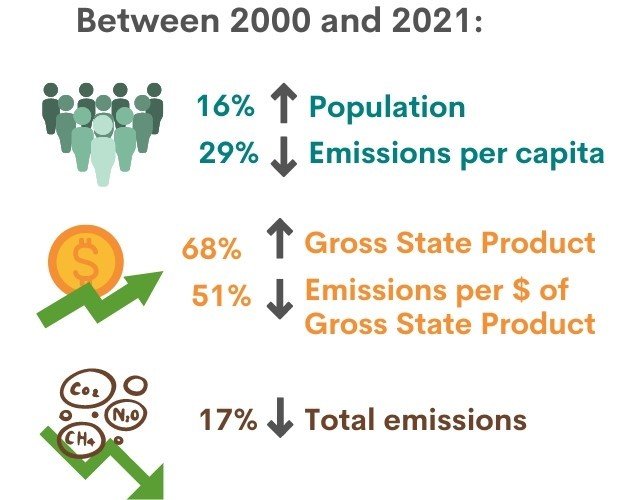
Trends in California's population, economy, and greenhouse gas emissions since 2000
Why is this indicator important?
- Greenhouse gas emissions reduction targets are set to prevent atmospheric concentrations from reaching levels at which catastrophic and irreversible impacts can occur. If global emissions continue to increase at the current rate, global temperatures will likely reach 1.5°C above pre-industrial levels between 2030 and 2052.
- Methane, certain fluorinated gases, and atmospheric black carbon are short-lived climate pollutants but are more powerful warming agents. Reducing their emissions can have a more immediate impact, slowing the rate of warming.
- Since the magnitude of warming associated with each greenhouse gas differs, understanding the pollutants’ relative effects on climate change is also essential for setting priorities and meeting emission reduction goals.
- Tracking greenhouse gas emissions trends provides critical information for policymakers to assess climate change mitigation options and the progress of emissions reduction programs.
What factors influence this indicator?
- Activities across all major economic sectors influence greenhouse gas emission levels. The transportation sector is the largest source in 2022 (making up almost 40 percent of total emissions), followed by the industrial sector (about 20 percent).
- Most greenhouse emissions are from the combustion of fossil fuel for energy. However, emissions are also associated with livestock and crop production, refrigeration and air conditioning, landfills, and other non-combustion sources.
- A range of socioeconomic factors, such as energy prices, consumer behavior, and population growth, can also affect greenhouse gas emissions.
- The transportation and electric power sectors drive most of the year-to-year changes in emissions. The steady decrease in transportation emissions since 2017 has been due to a significant increase in biodiesel and renewable diesel use. Reliance on renewable energy has led to large decreases in emissions from the electric power sector.
The transportation sector is the largest contributor to greenhouse gas emissions.
Credit: Eloi Omella, iStock
________
Additional resources:
- California Air Resources Board (CARB), Greenhouse Gas Emissions Inventory Program
- California Air Resources Board (CARB), Scoping Plan