
Precipitation
Credit: jxfzsy/Getty Images Signature
California receives about 75 percent of its annual precipitation from November through March, with about 50 percent occurring from December through February. As the winter months have become warmer in recent years, more precipitation has been falling as rain instead of snow over the watersheds that provide most of the state’s water supplies. For more information, download the Precipitation chapter.
Variability in precipitation is a natural feature of the state’s climate. Recent decades indicate larger swings between wet and dry periods (weather whiplash). This variability is partly influenced by atmospheric rivers, which are long, narrow bands of water vapor that carry substantial moisture from the tropics to the West Coast. Storms associated with atmospheric rivers provide about half of California’s precipitation and help end droughts, but they can also produce devastating floods. In December 2022, several warm and wet storms made landfall, bringing prolonged heavy rain and high-elevation snow.
A storm associated with an atmospheric river brought extreme rainfall to northern California in October 2021.
Source: GOES-17; NOAA/NESDISUS Storm Watch
What does the indicator show?
Statewide annual precipitation (1896-2024)
Precipitation totals are in inches and tracked by "water year," from the beginning of the typical start to the rainy season on October 1 through the following September 30, the end of the dry season. Statewide precipitation values range from a low of 10.75 inches (1924) to a high of 42.82 inches (1983), with an average of 23.5 inches over the entire period of record (1896-2023).
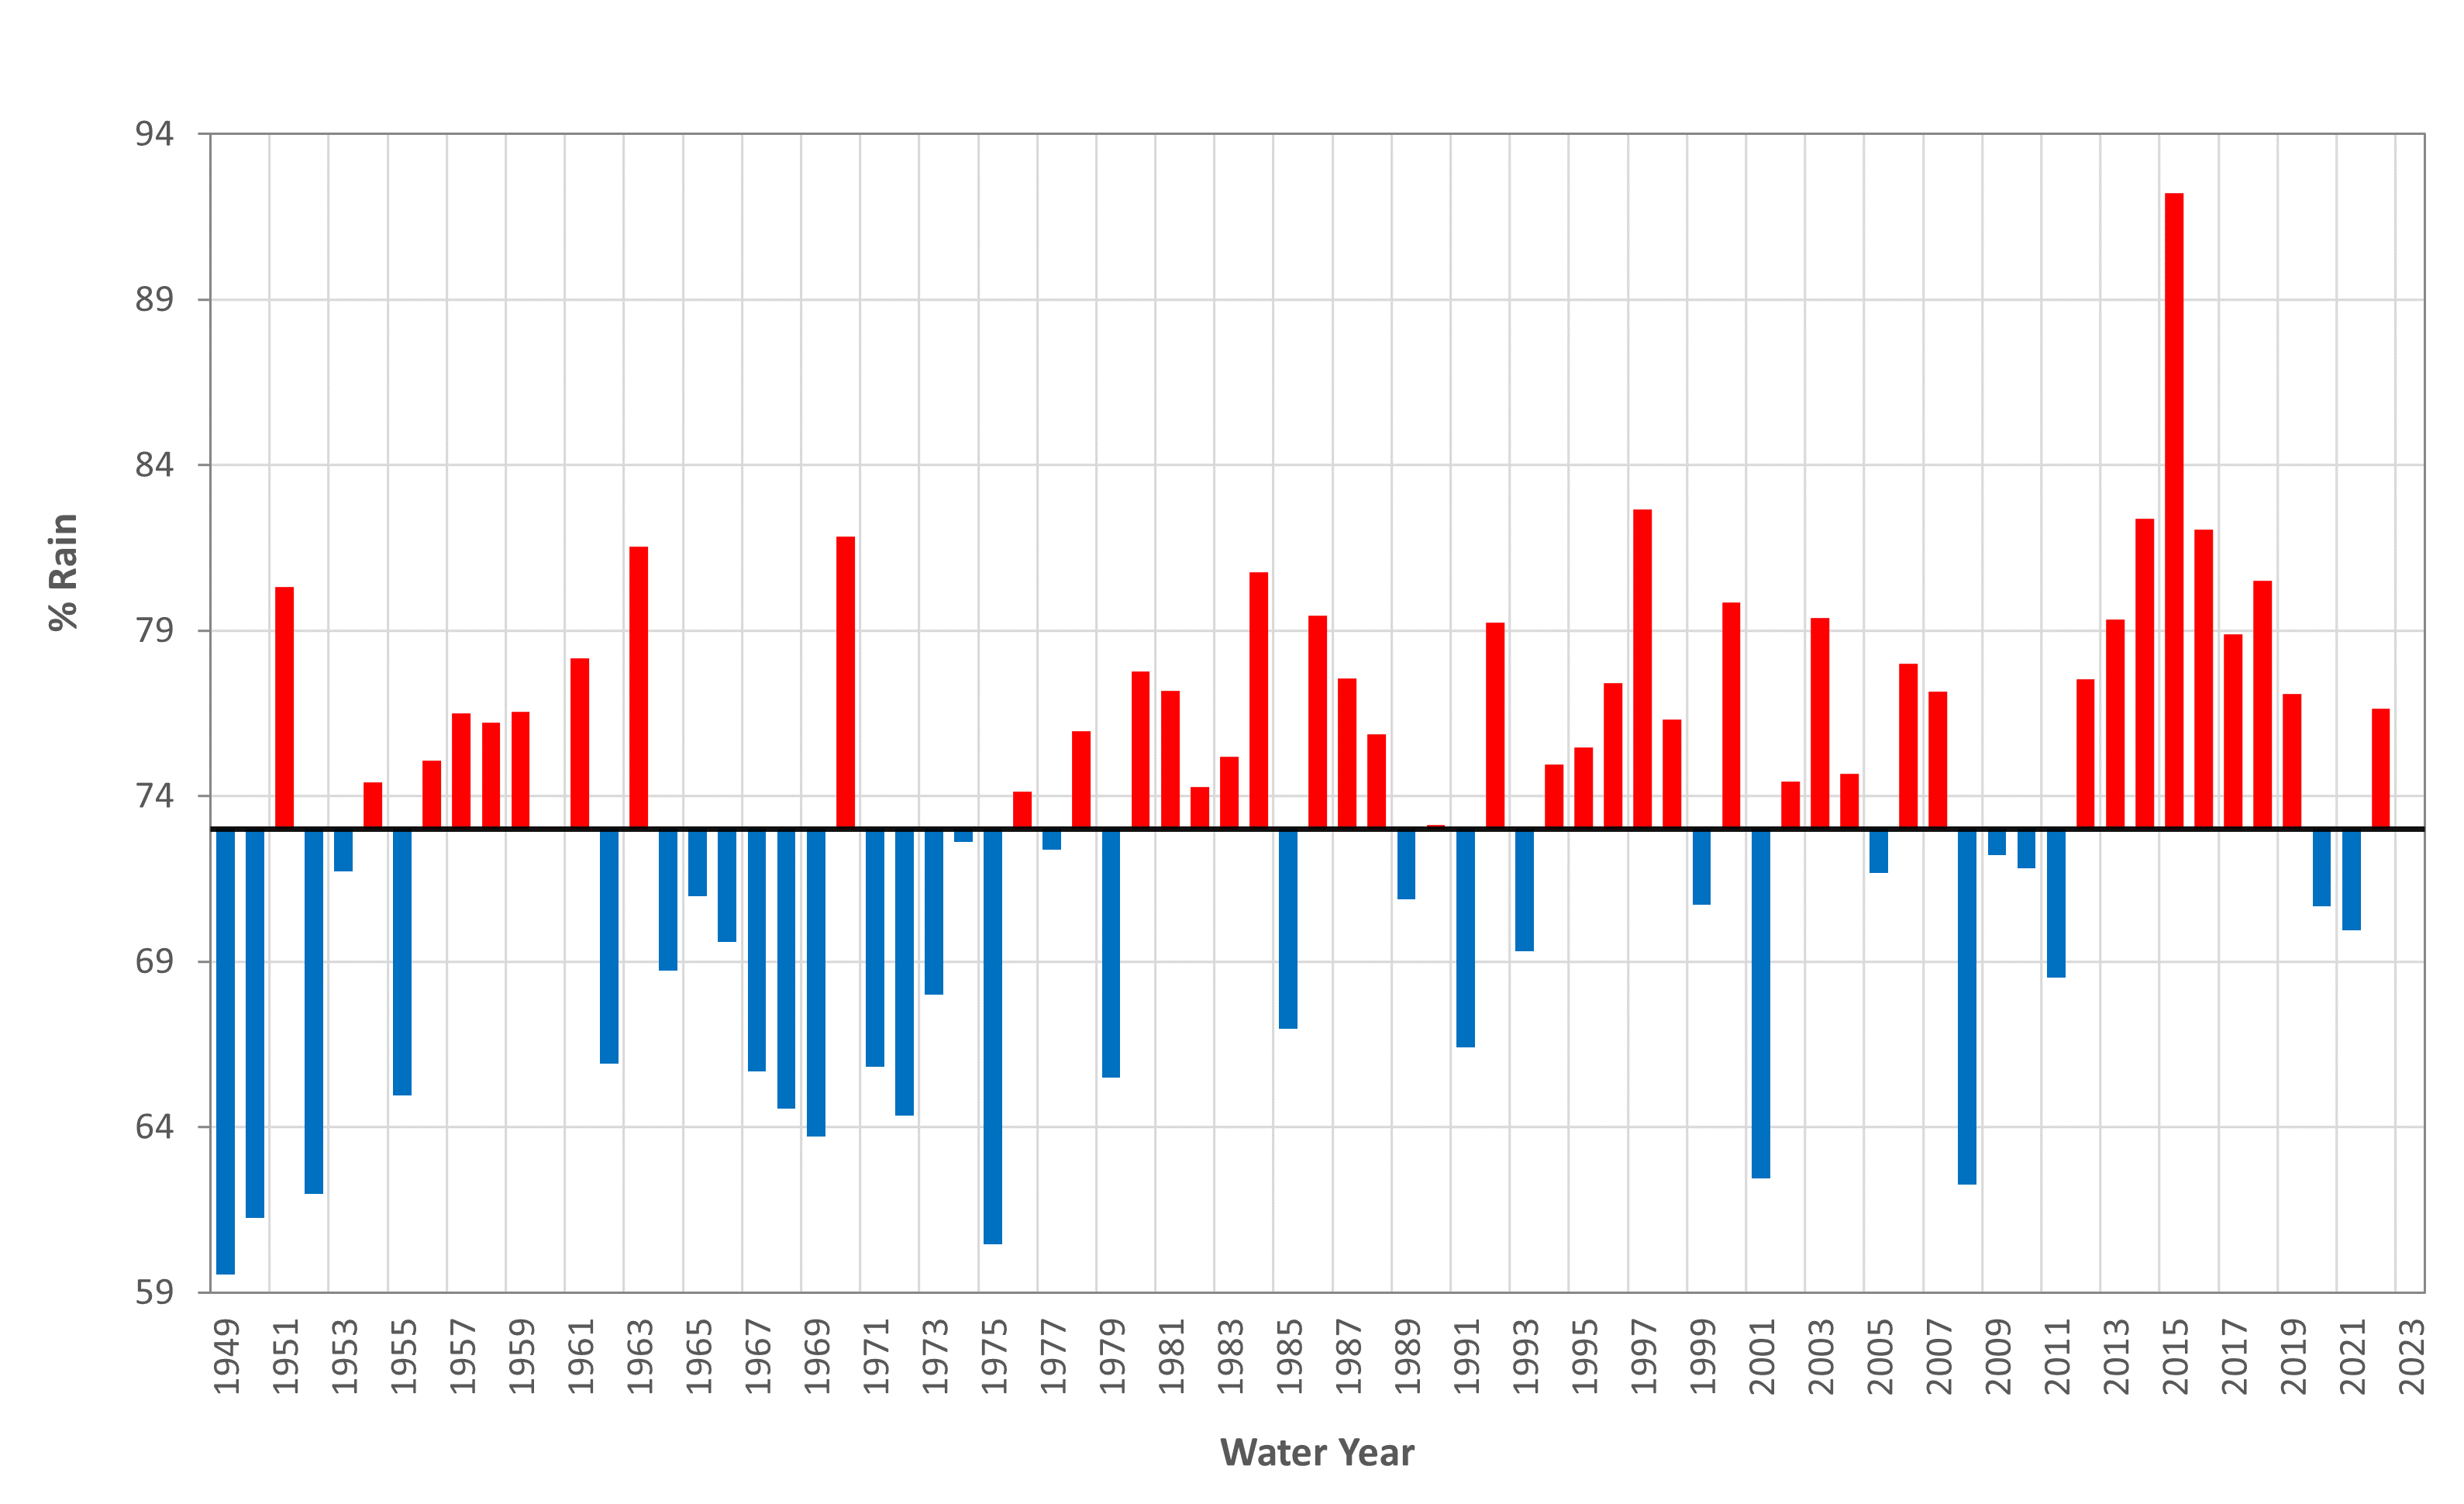
Rain as a percentage of total precipitation (1949-2022 water years)
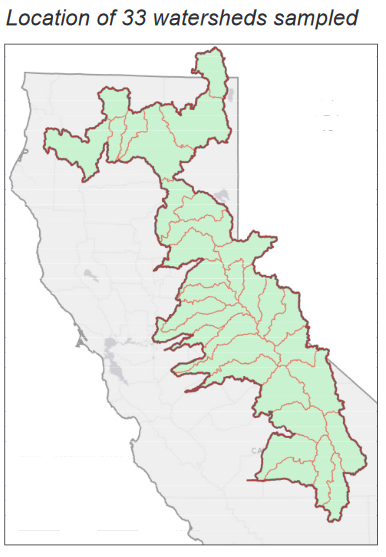
The graph below presents the percentage of yearly precipitation falling as rain over the 33 watersheds that provide most of the state’s water supply (shown on map). The bars show values relative to the average percentage of rain for the period 1949-2022 (73%): red bars are years with a higher percentage of rain than average (and thus less snow); blue bars are years with less rain and more snow than average.
Source: DWR, 2023
- In the past decade, California has had years with both record-high and record-low precipitation – swings consistent with climate change projections. Notably, 2012 to 2015 set a record for the driest consecutive four-year period, while 2017 was one of the wettest years on record.
- More precipitation is falling as rain instead of snow over the 33 watersheds that provide most of the state’s water supply. Snowpack was the lowest in 2015, which also had the highest percentage of rain (92 percent). It is important to note the percentage of snowfall is independent of total precipitation. A dry year with a higher percentage of snowfall can still mean drought.
Why is this indicator important?
- Precipitation is critical to support the natural environment and supplies water for drinking, household and industrial uses, agriculture, hydroelectric power generation, and other human uses.
- As dry and wet extremes continue to occur more often, California is experiencing swings between periods of drought and heavy rain. In addition to riverine flooding, heavy rainfall over areas burned by wildfire causes erosion that damages infrastructure and water quality and poses threats to life and property.
- With more rain and less snow, the snowpack plays a reduced role in supplying water to meet the state’s water demand.
What factors influence this indicator?
- Substantial year-to-year variability is a natural feature of California’s precipitation. This variability has increased in recent decades and is exacerbated by regional warming.
- Atmospheric and oceanic circulation patterns affect precipitation. For example, a persistent region of high pressure (called the Ridiculously Resilient Ridge) over the northeastern Pacific Ocean from 2012 to 2015 blocked storms from California and contributed to the severe drought.
- Local geography and storm characteristics also influence whether precipitation falls as rain or snow.
Additional resources:
- Cal-Adapt, Extreme Precipitation Events
- California Department of Water Resources, Hydroclimate Report
- National Oceanic and Atmospheric Administration, Atmospheric River Portal
- National Oceanic and Atmospheric Administration, California State Climate Summary 2022
- National Oceanic and Atmospheric Administration, Climate at a Glance
- National Oceanic and Atmospheric Administration, Storm Events Database
- Oregon State University, PRISM Climate Group
- Scripps Institution of Oceanography, Center for Western Weather and Water Extremes
- Western Regional Climate Center, State Climate Trackers