Air Temperatures

Credit: DutcherAerials/iStock
One of the most definitive indicators of climate change is air temperature. The rise in global air temperatures is linked to increased concentrations of carbon dioxide and other greenhouse gases in the Earth's atmosphere from human activities. Warming air temperatures impact the weather, the water cycle, human health and well-being, and ecosystems. For more information, download the Air Temperatures chapter.
What does this indicator show?
Statewide annual average air temperatures
This line graph shows the annual average air temperatures (°F) from 1895 to 2024 in the grey dotted line and the 11-year running average in the solid red line.

- Statewide annual mean temperatures have increased by about 2.5 degrees Fahrenheit (°F) since 1895. Warming has accelerated, and nine of the ten warmest years on record have occured since 2014.
- Some of the warmest years coincided with some of the driest years, leading to exacerbated drought conditions. Droughts of the 21st century have been hotter, longer lasting, and more widespread than before.
Why is this indicator important?
- A warming climate has far-reaching effects on our health, well-being, ecosystems, economy, and natural resources.
- Extreme heat, poor air quality, droughts, and other severe impacts of warming temperatures disproportionately fall on underserved communities. These communities are least able to prepare for, respond to, and recover from such impacts.
What factors influence this indicator?
- Carbon dioxide and other greenhouse gases have driven rapid warming worldwide.
- Temperatures are also influenced by the natural and urban landscape, elevation, proximity to the ocean, and atmospheric and oceanic circulations.
- Changes in land use and land surface exert local effects on temperature. For example, heat-absorbing concrete and asphalt in buildings and roads have a warming effect, and irrigation has a cooling effect.
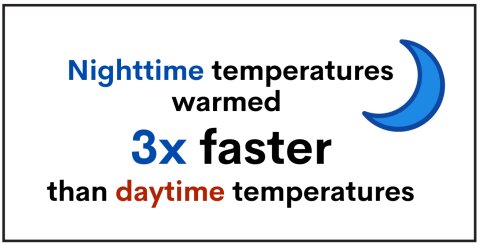
Southern California is warming about twice as fast as Northern California.

Credit: Getty Images/MattGush
Additional resources
- CalAdapt, Annual Averages
- Calfornia Energy Comission, Governor's Office of Planning and Research and Natural Resources Agency, California's Fourth Climate Change Assessment
- National Oceanic and Atmospheric Administration, California State Climate Summary 2022
- National Oceanic and Atmospheric Administration, Climate at a Glance
- National Oceanic and Atmospheric Administration, Storm Events Database
- Western Regional Climate Center, State Climate Trackers
- Oregon State University, PRISM Climate Group
- University of Oxford, Global Warming Index
