Occupational Heat-related Illness
 Credit: saravut vansent/Pexels
The link between heat exposure and heat-related illnesses in workers is well documented globally. Heat-related illnesses encompass a broad range of symptoms, including headaches, dizziness, cramps, rapid heartbeat, and disorientation to more serious outcomes, including heat stroke. Although largely preventable, heat-related illnesses often occur among employees with little control over their work environment and limited ability to take appropriate actions when working under hot conditions. For more information, download the Occupational Heat-related Illness chapter.
What does this indicator show?
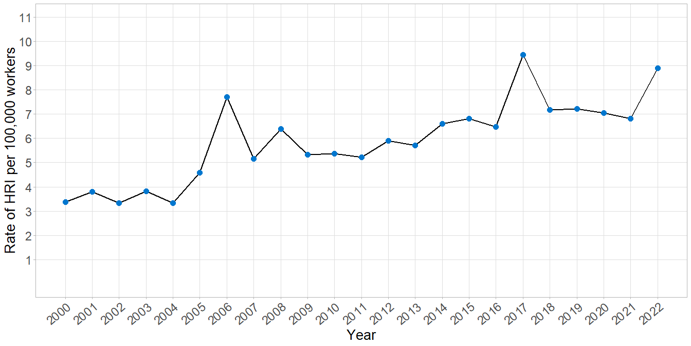
Occupational heat-related illnesses
This graph presents annual rates of occupational heat-related illnesses (HRI) per 100,000 California workers from 2000 to 2022 based on an analysis of workers’ compensation claims.
Rates of heat-related illness (HRI) emergency department visits by county, 2000-2023
Counties with rates of HRI ≥ 15 per 100,000 workers are labeled. North to south, the counties are Shasta, Madera, Kings, and Imperial. Counties shown in gray reported relatively few total emergency department (ED) visits, preventing reliable estimates of the rate.
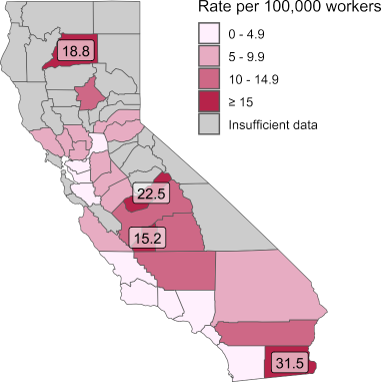
Source: CDPH Occupational Heat-Related Illness Emergency Department Visits, California, 2016-2023
- The yearly rate of heat-related illnesses among workers has nearly doubled from 2000 to 2022. These numbers are based on reported cases in workers’ compensation claims.
- From 2016 to 2023 there were 5,925 emergency department visits for work-related heat illness, with 4.3 visits for every 100,000 California workers occurring per year on average. The highest rates were seen in Shasta, Madera, Kings, and Imperial counties.
Why is this indicator important?
- Occupational heat-related illnesses have continued to increase in California. Tracking these illnesses can help assess the effectiveness of the current heat-related illness prevention standard and inform other actions and policies to protect workers.
- Workplace heat-related injuries in CA cost millions of dollars each year in health care expenditures, lost wages and productivity, and disability claims.
What factors influence this indicator?
- Heat-related illnesses cases generally occur during periods of exceptionally warm temperatures. Cases spiked in 2006, the year California experienced a prolonged heat wave. A sharp uptick in cases also occurred in 2017 when summertime temperatures were exceptionally warm.
- Rates of occupational heat-related illnesses vary by industry and occupation, and demographics. Workers at greater risk of heat-related illnesses include:
- People who perform heavy labor or work outdoors
- Police and firefighters
- Farmworkers, particularly those who work long days during the summer and have limited control over their work schedule and job tasks.
- People with underlying vulnerabilities, such as those who are lower income, have chronic illnesses, or have no health insurance; these workers are often from communities of color.
Workers pick cantaloupe melons at Del Bosque Farms in Firebaugh, California, on June 12, 2017. Temperatures reached 100 degrees on this day.

Credit: Joe Proudman/UC Davis
Additional resources:
- California Department of Industrial Relations (DIR), CalOSHA Heat illness prevention
- California Department of Public Health (CDPH), Occupational Health Watch
- Centers for Disease Control and Prevention (CDC), OSHA-NIOSH Infosheet: Protecting Workers from Heat Illness