Graphical Illustrations – Exploring Climate Change Connections
"Exploring California Climate Change Connections: What Science Knows," held December 2 and 3, 2020, explored the latest scientific evidence for the interconnections between climate change and its impacts, featuring presentations from leading researchers and representatives of tribes and community organizations. The workshop consisted of the following sessions: changes in climate; impacts on physical systems; impacts on human health and well-being; impacts on vegetation; and impacts on fish and wildlife.
The drawings below are graphical summaries of the workshop presentations (created by Adi Leigh Brown, 10X COLLECTIVE).
- To view the workshop agenda.
- For a summary of the workshop.
- For a full list of the video recordings.
Keynotes and opening/closing remarks
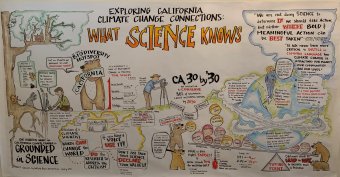
Poster illustrating Exploring California Climate Change Connections: What Science Knows
Main message: Our collective work in California climate change is grounded in science.
Drawing of a tree with small mammal, a bird, insects and a Native American woman beneath the tree making a blessing before a plant. You have the responsibility to take care of this land, insects, birds, trees, grasses, fog (Mother Earth). Blessings Creator we depend on your guidance until the last sunrise. With our care the plants developed deep roots to protect them from fire, flood and drought. (from prayer by Valentin Lopez, Amah Mutsun Tribal Band).
Drawing of a standing brown bear holding the State of California. We are a biodiversity hotspot but our plants and animals are under significant threat. It is important to look at biodiversity at multiple time scales: acute events – the “Blob”, wildfire; decadal – day of first flight of butterflies, drought; centennial – forest structure, decline in large trees; geologic – forest transition from conifer to oak. Drawing of man using a survey instrument depicting Grinnell early 1900’s biodiversity survey. (David Ackerly, UC Berkeley).
Reflections of a climate scientist from the 1995 IPCC meeting in Madrid- the balance of evidence suggests a discernible human influence on global climate. Evidence included climate fingerprints, volcanoes, sulfate pollution, water vapor, solar forcing, temperature, greenhouse gases. Words can change the world. If you have a voice, use it. Do the research to address the criticism. Don’t just talk about science, declare our values. (Ben Santer, Lawrence Livermore National Laboratory).
Drawing of a bear holding another bear on its shoulders positioned on both ends of a tipping seesaw. The fulcrum is the “tipping point”. The objective is stabilization of CO2 in the atmosphere at a level that would prevent dangerous anthropogenic interference with the climate system. Potential tipping cascades(shown as weights on seesaw) include: Greenland ice sheet, alpine glaciers, permafrost, jet stream, Arctic summer sea ice, boreal forest, West Antarctic ice sheet, thermohaline circulation, Sahel, Indian summer monsoons, coral reefs, El Nino Southern Oscillation. Question - what is the target and how much time do we have? A thermometer shows average global temperature rising above pre-industrial levels. Time to a 1.5 degree Centigrade increase is about 9 years and a 2 degree increase is about 26 years, based on 2019 cumulative emissions rate. California needs to lead the way to validate what is possible. (Chris Field, Stanford Woods Institute for the Environment).
Banner showing CA 30 by 30 – an initiative to conserve 30 percent of California lands and coastal waters by 2030. Main concepts: conserve- manage change-connect.
Text balloon: “We are not doing science to determine IF we should take action but WHERE bold and meaningful action can be BEST taken”. (Jared Blumenfeld, Secretary, CalEPA).
Text balloon: “It has never been more critical to distill in common language how climate change is impacting our planet, our communities, and our lives”. (Wade Crowfoot, Secretary, California Natural Resources Agency).
Drawing of woman scientist standing on the globe with connecting arrows around the globe. Text balloons: We spend a lot of time thinking about how to bring science and stakeholders together. We need the best available climate impact projections downscaled to community scale. The impressive gains in cloud computing are allowing for cloud crowd-sourced science to be contributed from around the globe. Climate denial is masking a discomfort about what climate change impact will mean. How do we make it less scary so we can get more people behind us? “These are unprecedented times. I look forward to bouncing forward to a more equitable and science-based future that includes engaging with our most vulnerable communities.” (Kate Gordon, Governor’s Office of Planning and Research).California's Changing Climate
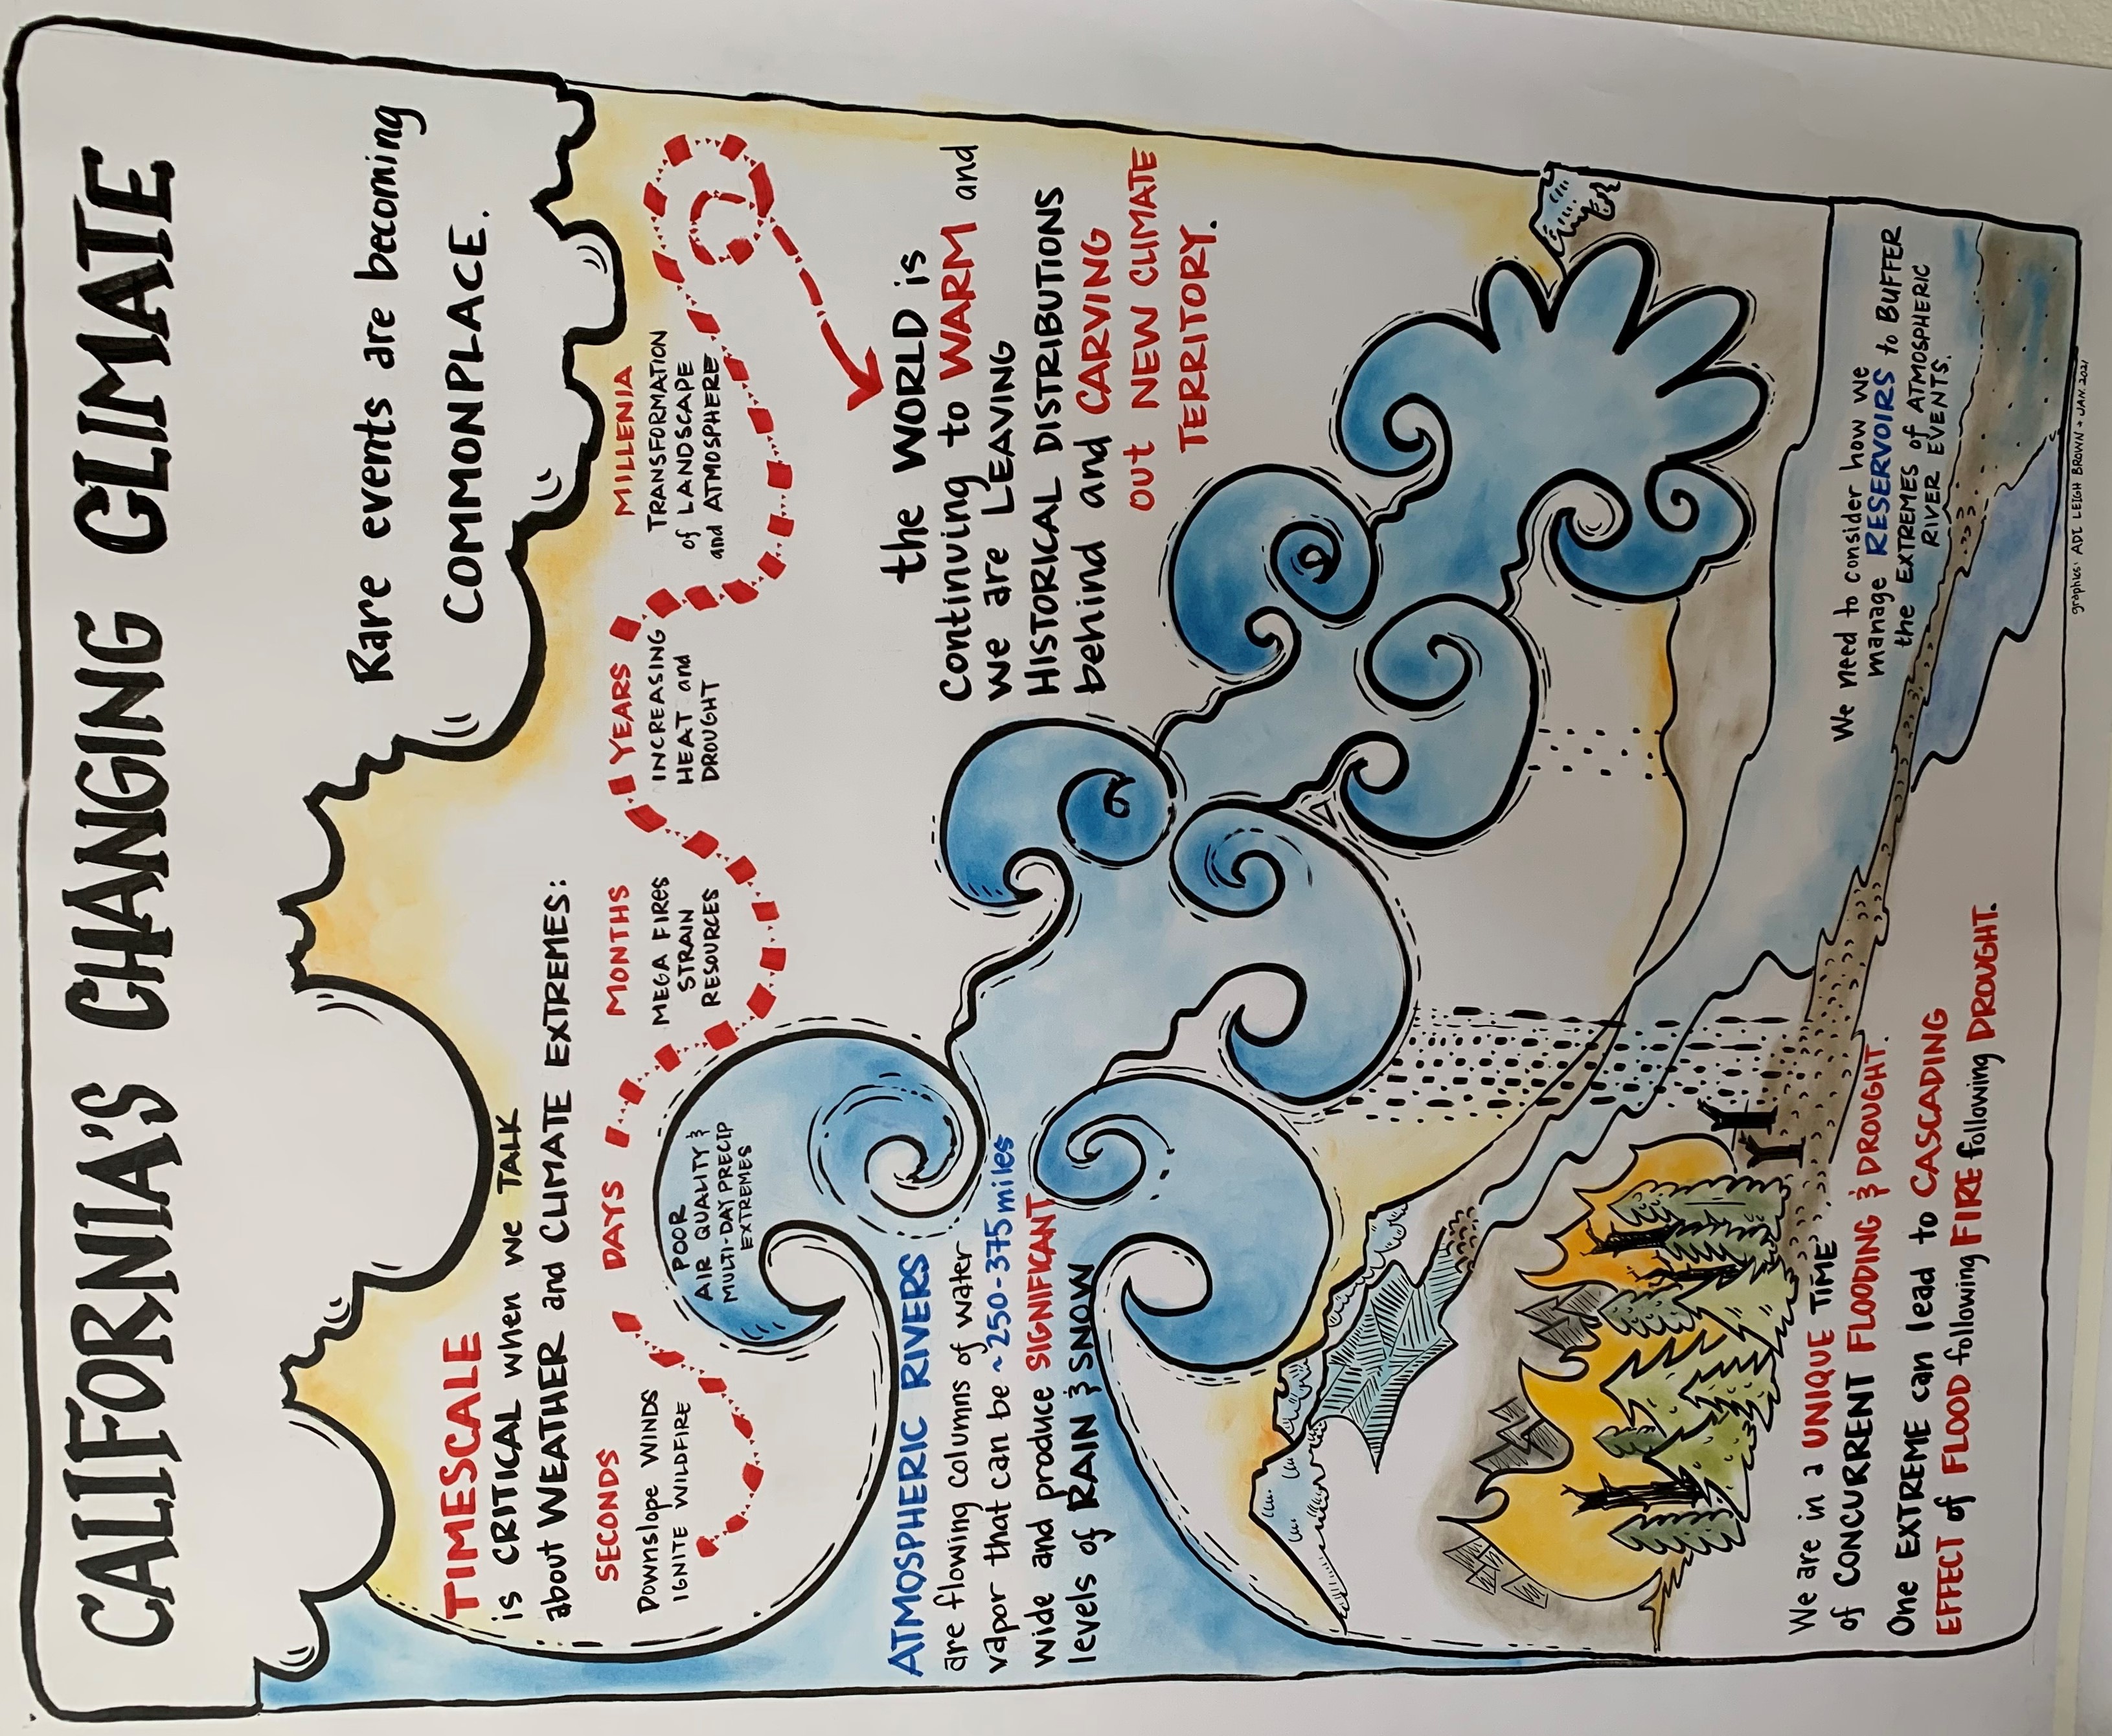
Poster illustrating California’ Changing Climate
A main theme is rare events are becoming commonplace.
A rolling timeline showing timescale is critical when we talk about weather and climate extremes – seconds, days, months, years, millennia. Impacts occurring over time include winds impacting wildfire; poor air quality; multi-day precipitation extremes; mega fires straining resources; increasing heat and drought; transformation of landscape and atmosphere.
The world is continuing to warm and we are leaving historical distributions behind and carving out new climate territory.
A large wave of water flows across the poster. Atmospheric rivers are flowing columns of water vapor that can be 250 to 375 miles wide and produce significant levels of rain and snow.
Drawing of mountains, heavy rain, runoff and forest fire. We are in a unique time of concurrent flooding and drought. One extreme can lead to cascading effect of flood following fire following drought. We need to consider how we manage reservoirs to buffer atmospheric river events.Impacts on Californian's Health and Well-being
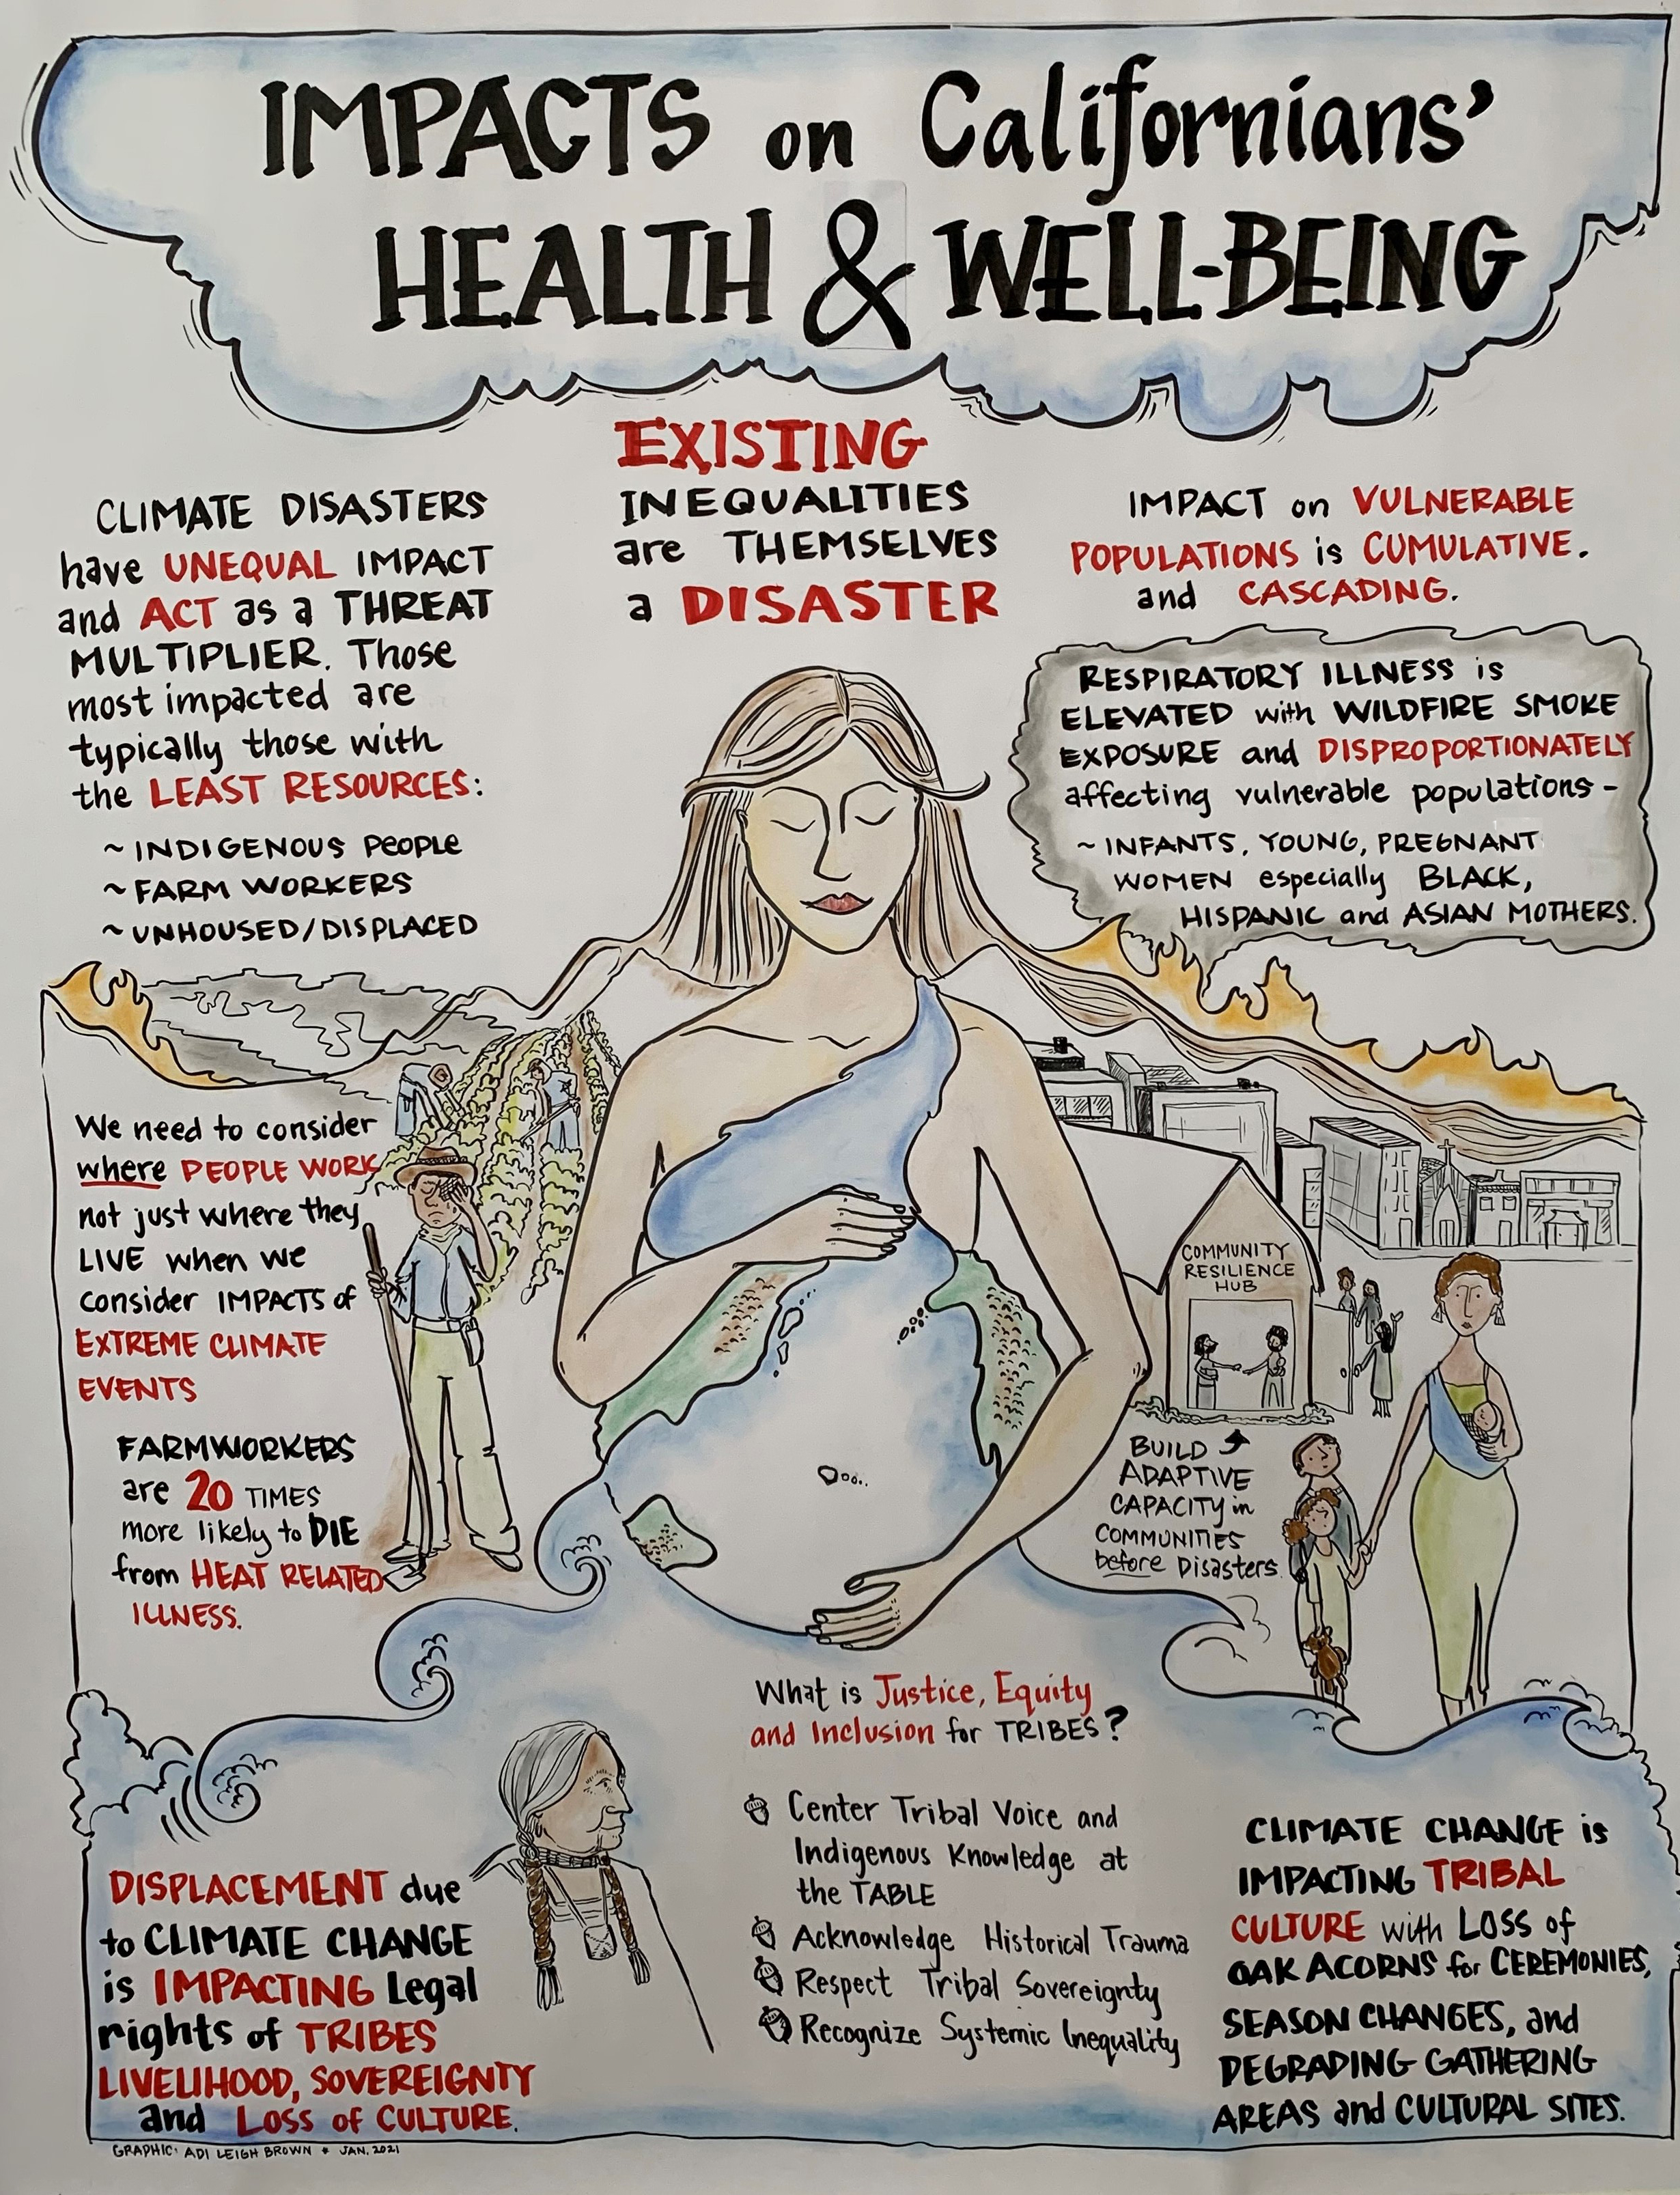
Poster illustrating impacts on Californians’ health and well-being
Main messages at top of poster:
- Climate disasters have unequal impact and act as a threat multiplier. Those most impacted are typically those with the most resources – indigenous people, farmworkers, unhoused/displaced.
- Existing inequalities are themselves a disaster.
- Impact on vulnerable populations is cumulative and cascading.
Drawing of farmworker in the field suffering from heat. We need to consider where people work, not just where they live when we consider impacts of extreme climate events. Farmworkers are 20 times more likely to die from heat-related illness.
Drawing of pregnant woman depicted as mother earth figure with wildfire in background behind buildings. Respiratory illness is elevated with wildfire smoke and disproportionately affecting vulnerable populations – infants, young, pregnant women, especially Black, Hispanic and Asian mothers.
Drawing of a “community resilience hub” with community members gathered. Build adaptive capacity in communities before disasters.
Drawing of Native American person. Displacement due to climate change is impacting legal rights of tribes’ livelihood, sovereignty, and loss of culture.
What is justice, equity and inclusion for tribes? A list is provided:
- Center tribal voice and indigenous knowledge at the table.
- Acknowledge historical trauma
- Respect tribal sovereignty
- Recognize systemic inequality
Impacts on the Physical Systems and their Connections
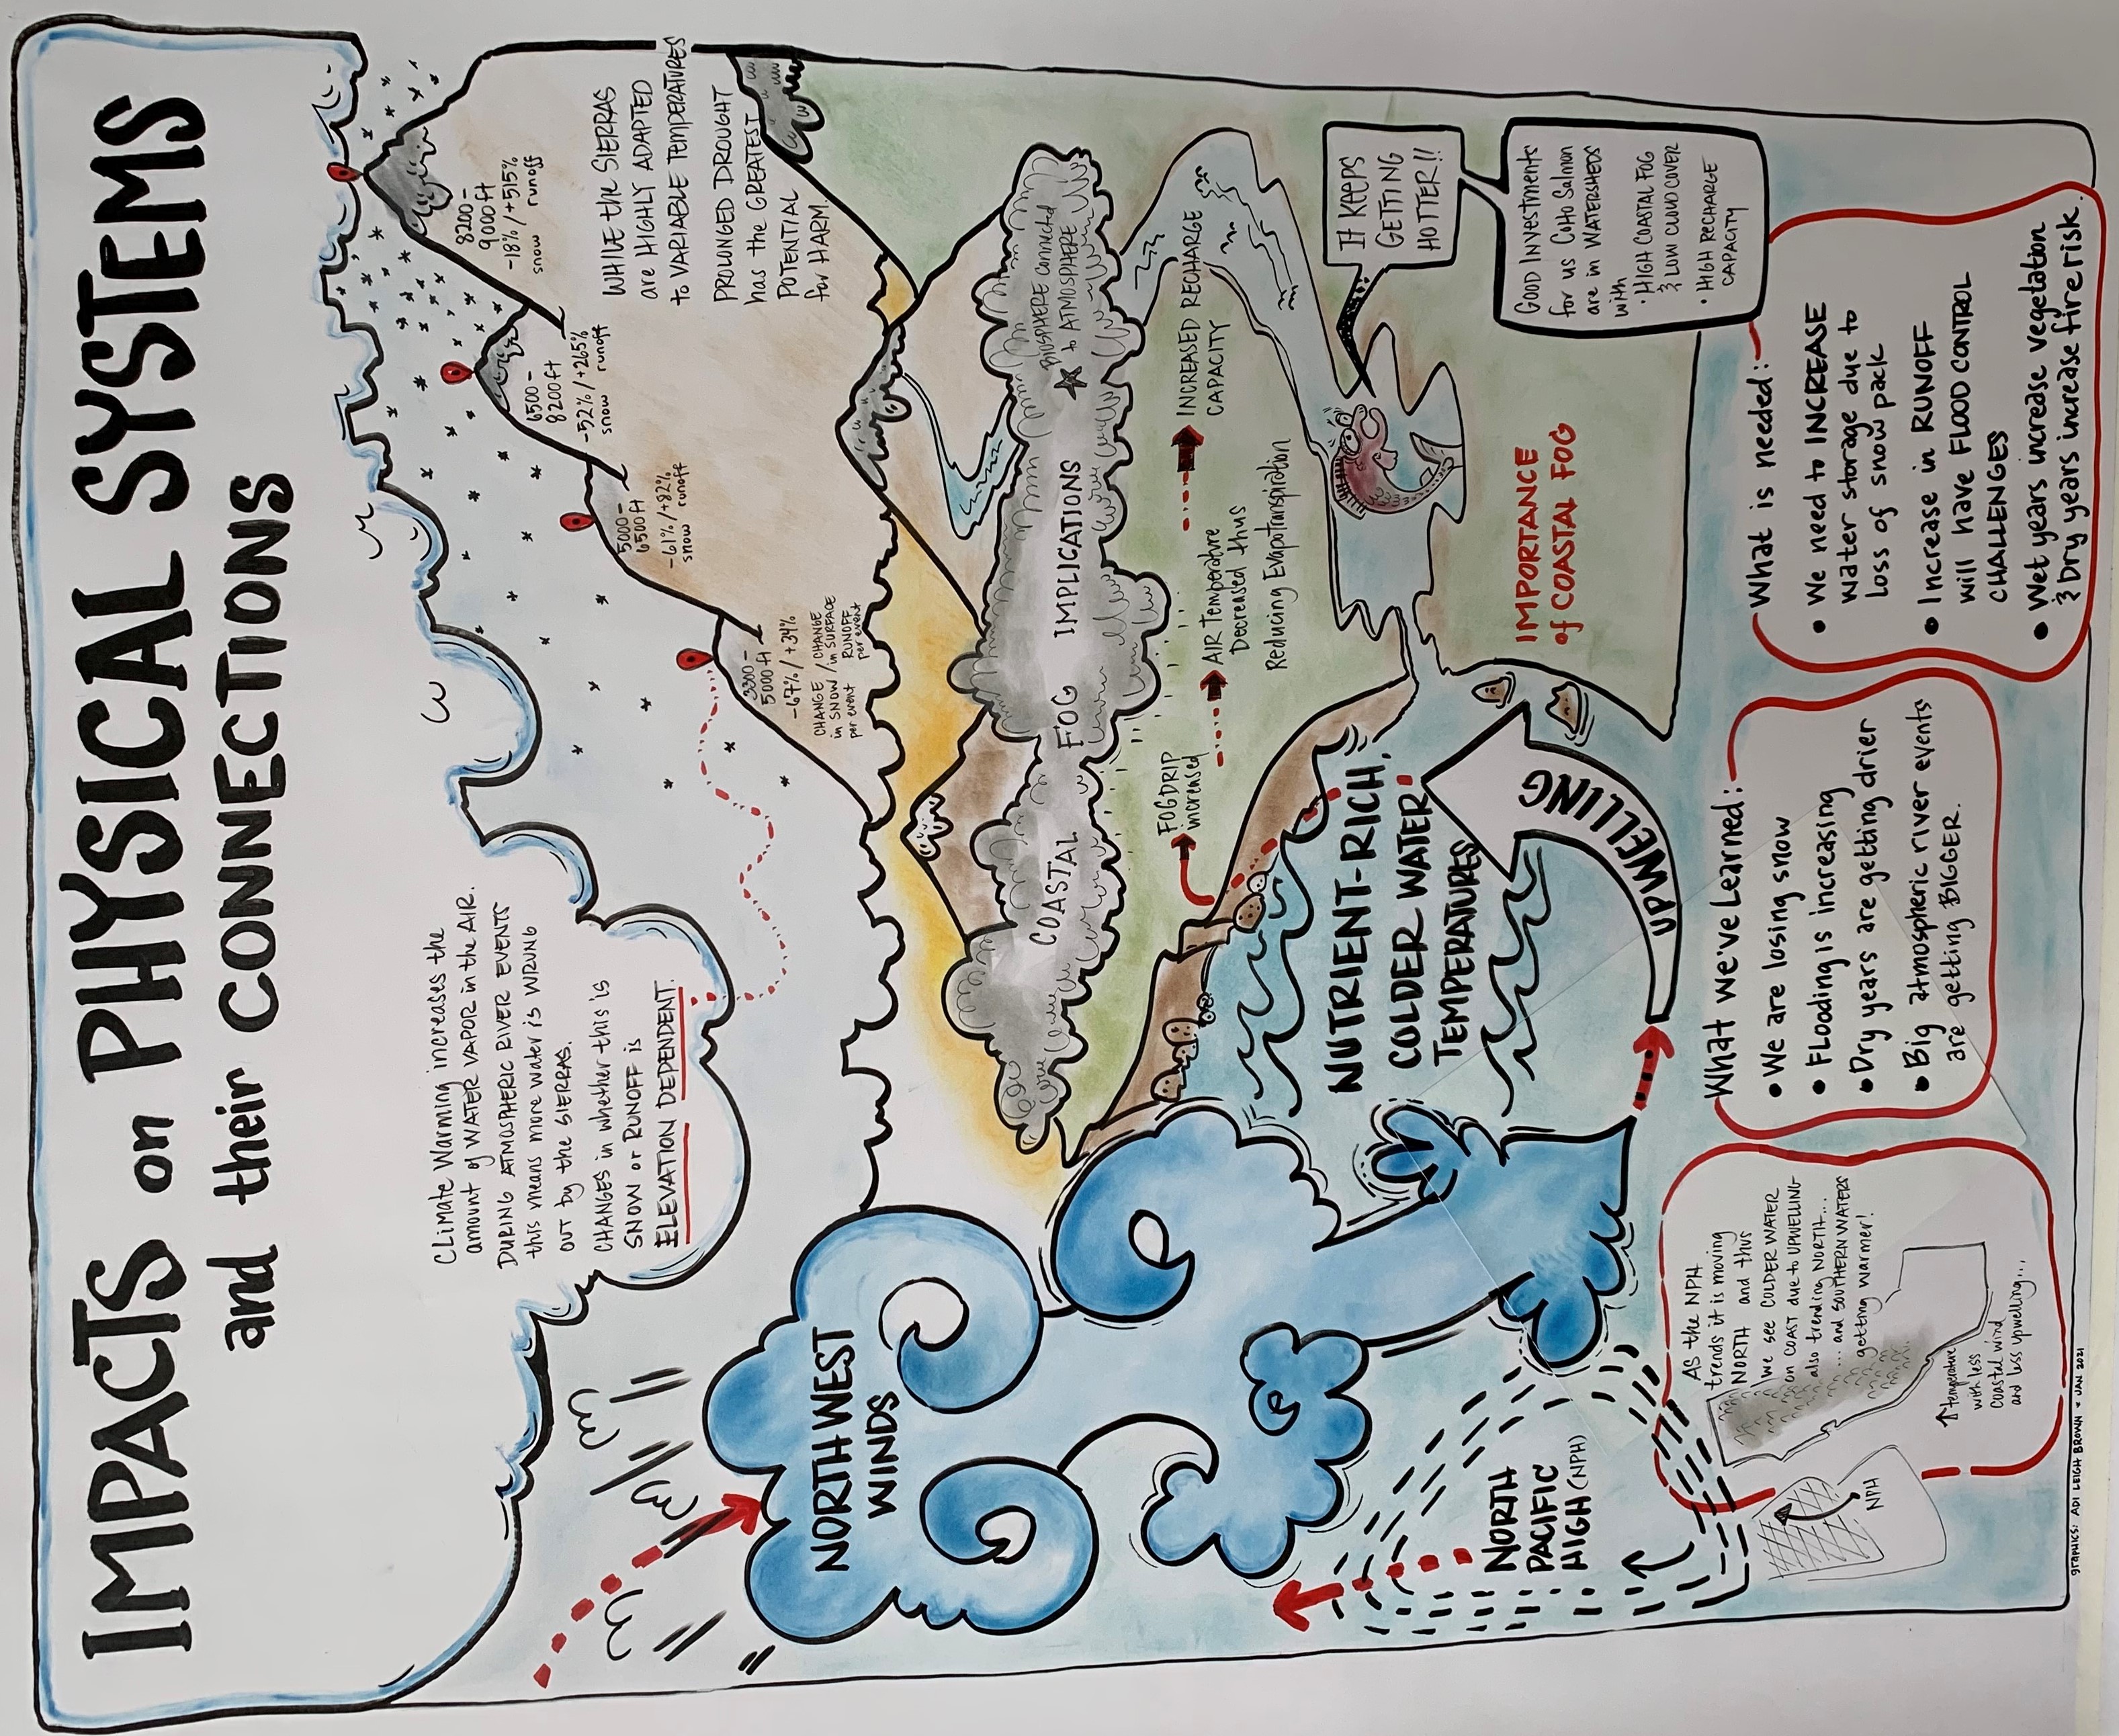
Poster illustrating impacts on physical systems and their connections
Giant cloud with caption: Climate warming increases the amount of water vapor in the air. During atmospheric river events this means more water is wrung out by the Sierras. Changes in whether this is snow or runoff is elevation dependent.
Drawing of mountains depicting Sierra Nevada showing increasing elevations and estimated changes in snow per precipitation event and surface runoff per event. At 3300-5000 feet: change in snow is minus (-)67% and runoff is plus (+)34%; at 5000-6500 feet: -61% and +82%; at 6500-8200 feet: -52% and +265%; and at 8200-9000 feet: -18% and +515%. While the Sierras are highly adapted to variable temperatures, prolonged drought has the greatest potential for harm.
Drawing of large swirling arrow depicting northwest winds that cause coastal upwelling, which produces colder nutrient-rich waters. Dashed-line circle showing the offshore North Pacific High (NPH). As the NPH trends, it is moving north along the coast and thus we see cold water also trending north and southern waters getting warmer. Where ocean temperature is increasing along the south coast, there is less coastal wind and less upwelling.
Drawing of cloud-like figure depicting coastal fog and how the biosphere is connected to the atmosphere. With coastal fog, fog drip increases; the air temperature is decreased, thus reducing evapotranspiration; this increases recharge capacity. Importance of coastal fog – good investments for us when Coho salmon are in watersheds with high coastal fog and low cloud cover and high recharge capacity. Drawing of stressed fish saying “It keeps getting hotter!”
Text balloon: What we’ve learned: We are losing snow; flooding is increasing; dry years are getting drier; big atmospheric river events are getting bigger.
Text balloon: What is needed: We need to increase water storage due to loss of snowpack; increase in runoff will have flood control challenges; wet years increase vegetation and dry years increase fire risk.
Impacts on California Vegetation and their Connections
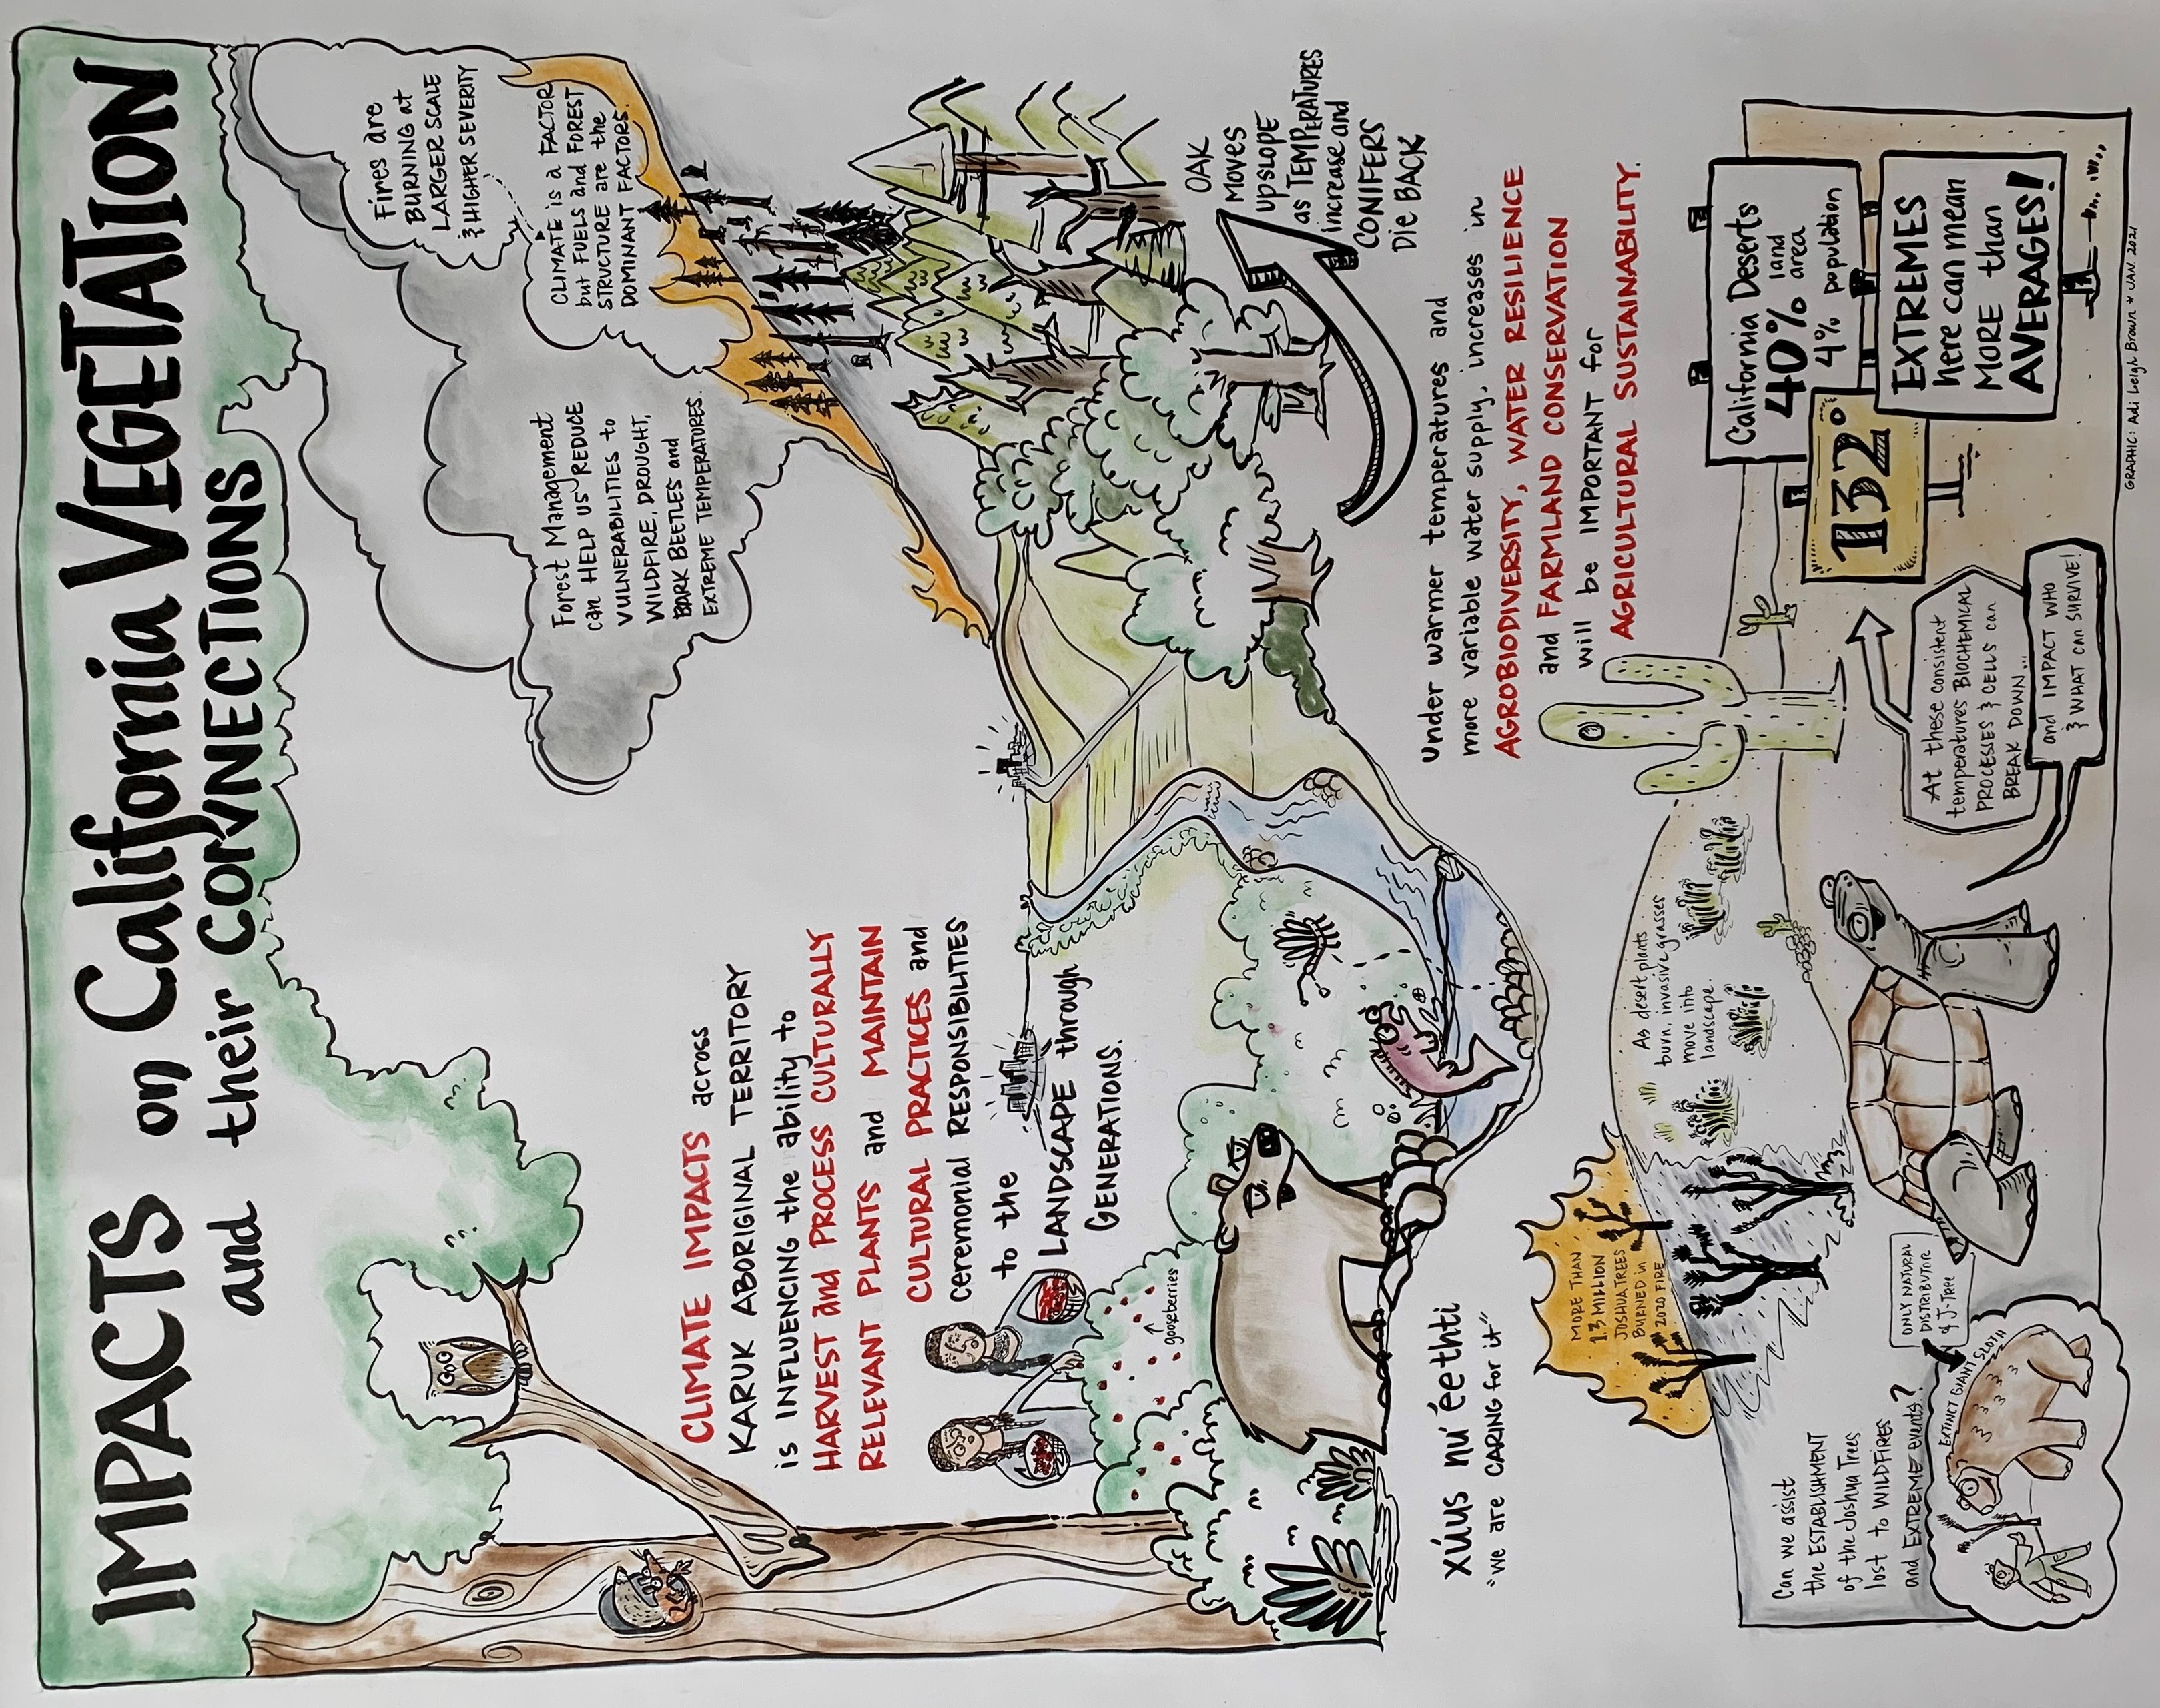
Poster illustrating impacts on California vegetation and their connections
Drawing of two Native American women under a large tree carrying baskets with gooseberries and next to forest animals and a flowing river. Climate impacts across Karuk Aboriginal territory is influencing the ability to harvest and process culturally relevant plants and maintain cultural practices and ceremonial responsibilities to the landscape through generations.
Native American language quote – “We are caring for it”
Drawing of dead trees on a hillside. Fires are burning at larger scale and higher severity. Climate is a factor but fuels and forest structure are the dominant factors. Forest management can help reduce vulnerabilities to wildfire, drought, bark beetles and extreme temperatures.
Drawing of oak and conifer trees on a mountainside. Oaks moves upslope as temperatures increase and conifers die back.
Under warmer temperatures and more variable water supply, increases in agrobiodiversity, water resilience and farmland conservation will be important for agricultural sustainability.
Drawing of a desert scene showing extinct giant sloth (only natural distributor of Joshua Tree), a tortoise, burned Joshua Trees and invasive grasses. More than 13 million Joshua Trees burned in the 2020 fire. Can we assist the establishment of Joshua Trees lost to wildfires and extreme events? As desert plants burn, invasives move into the landscape.
Drawing of signs showing California deserts are 40 percent of the State’s lands area and 4 percent of its population. Extremes here can mean more than averages. At 132 degrees, biochemical processes and cells can break down and impact who and what can survive arrow pointing to tortoise.Impacts on California Wildlife and their Connections
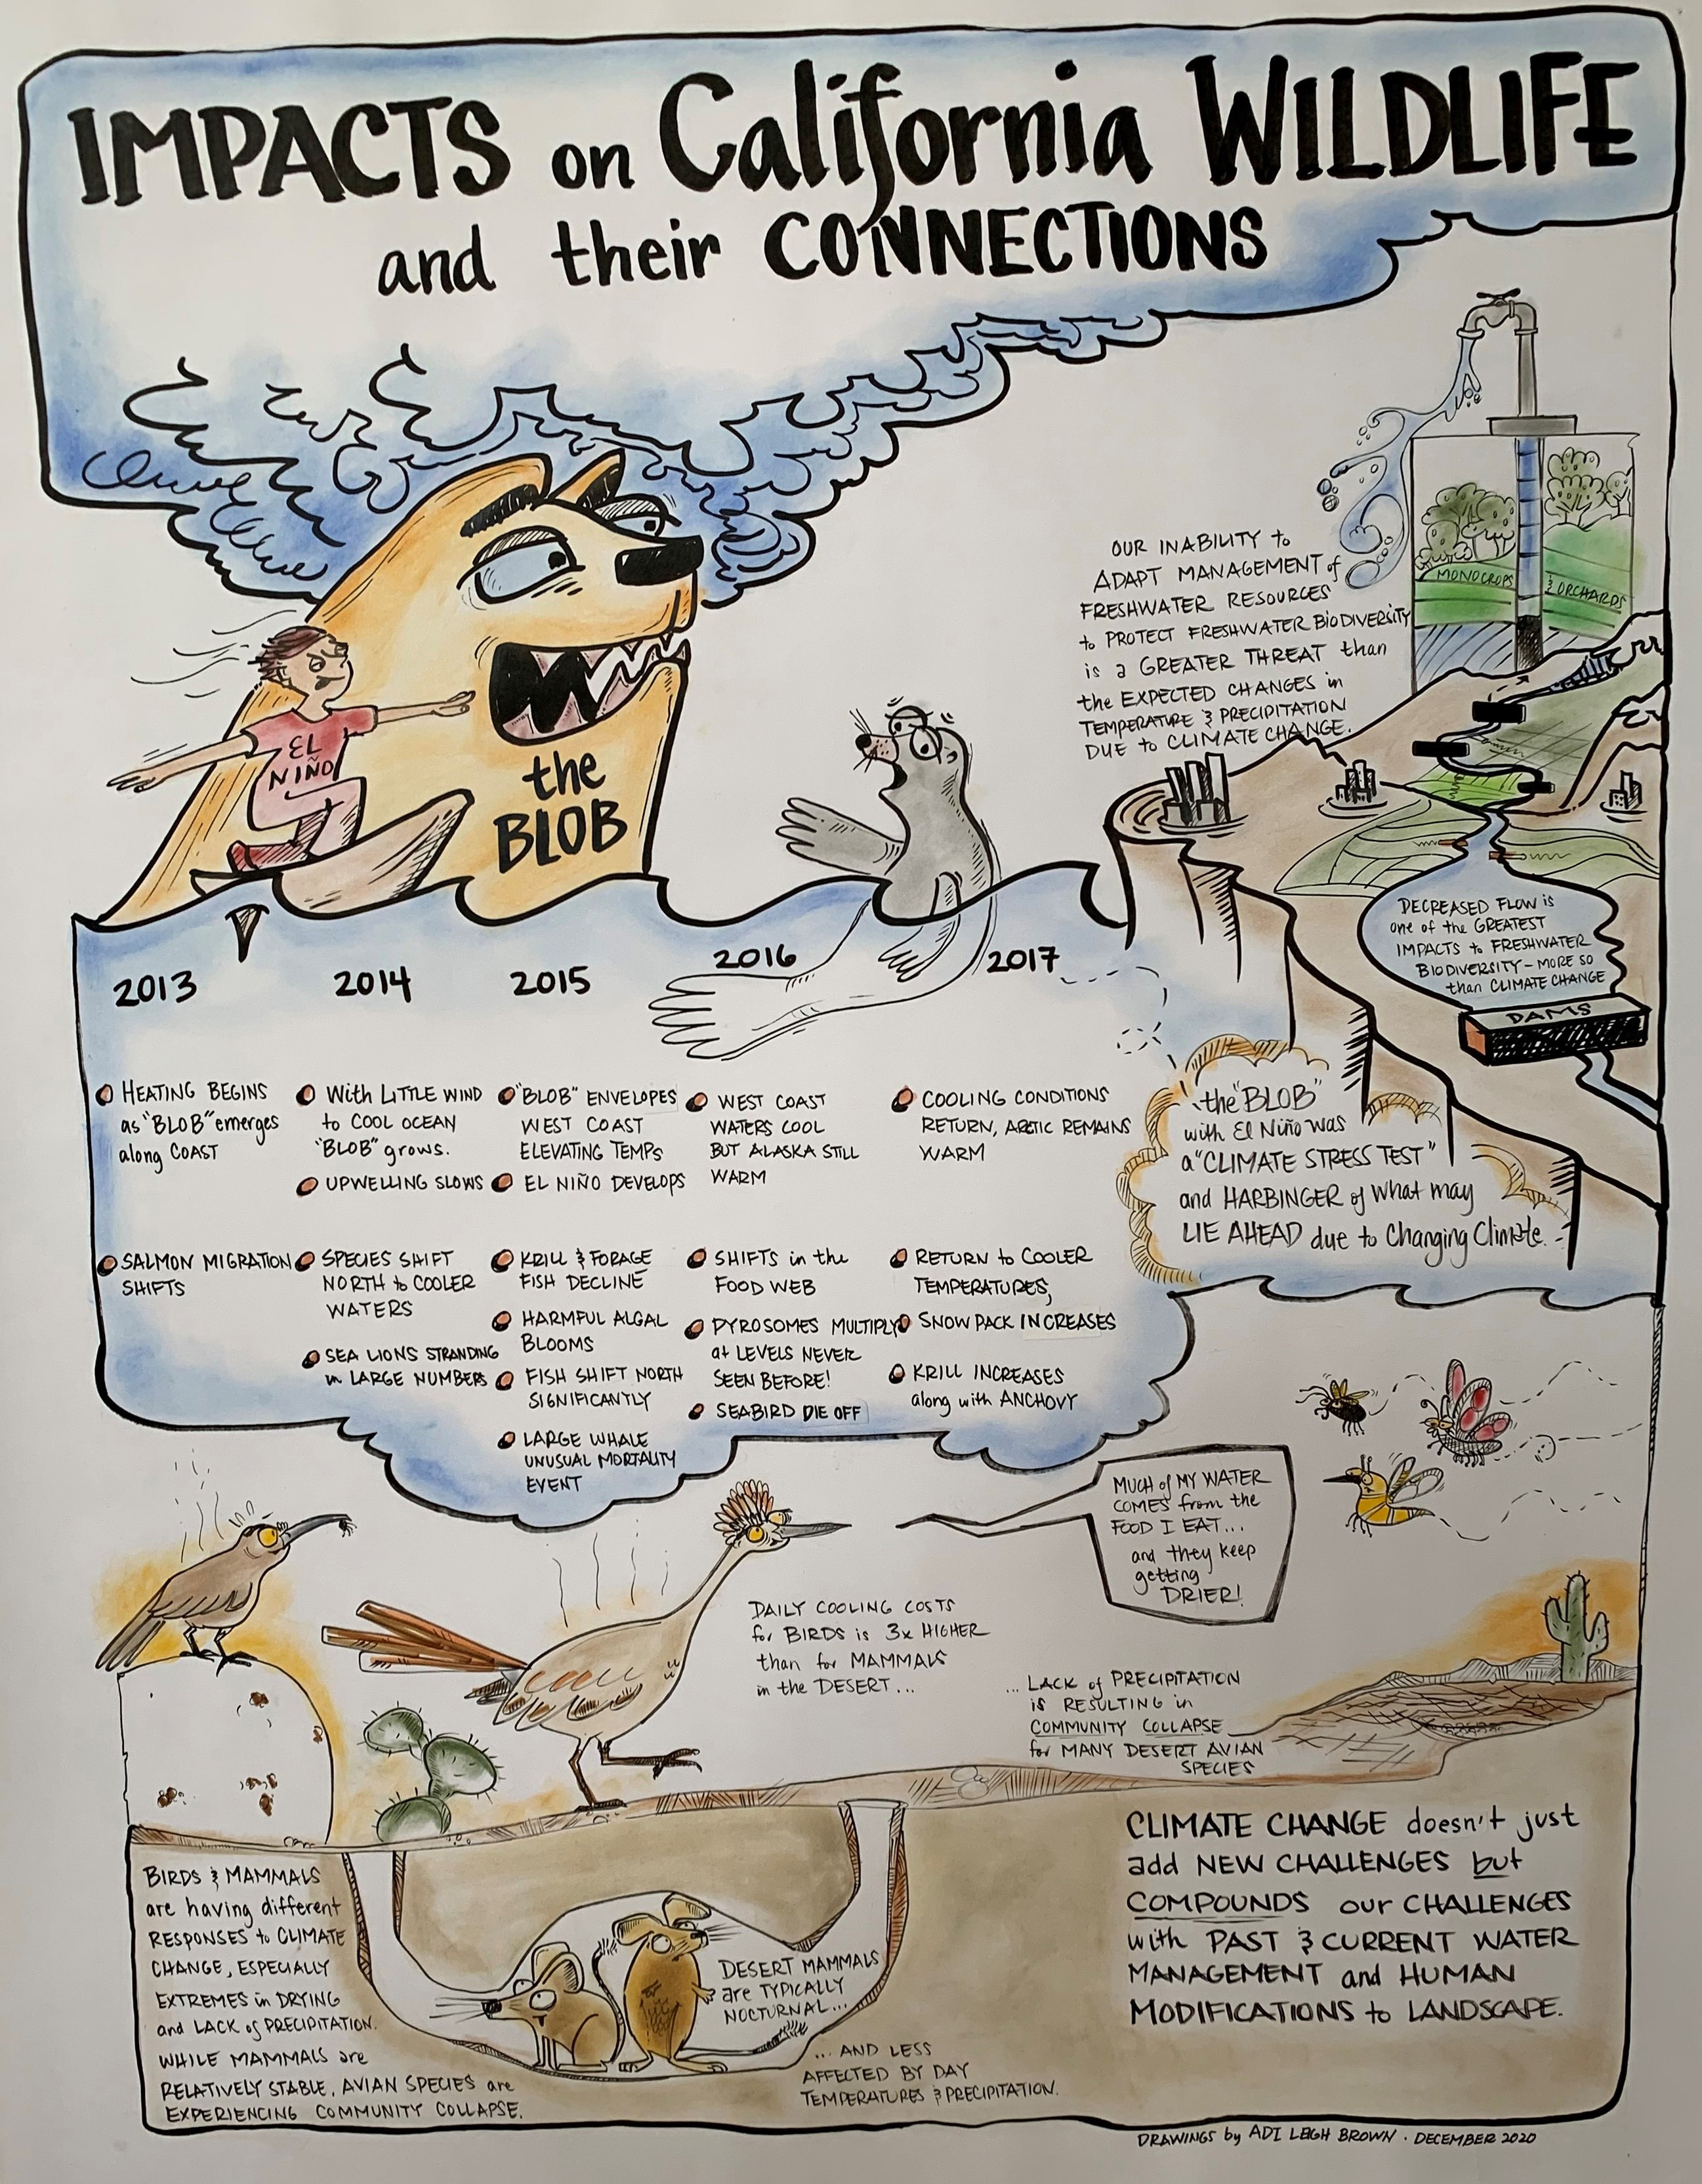
Poster illustrating impacts on wildlife and their connections
Image is a hand drawing that illustrates points raised during the “Impacts on wildlife and their connections” session. The drawing shows:
Image of a large aggressive animal bearing its teeth depicting the warm “Blob” alongside a surfer riding a wave representing El Niño. A sea lion is suffering in the warm waters.
A timeline underlies the Blob showing events between 2013 and 2017:
- 2013 - heating begins as Blob emerges along coast; shifts in salmon migration
- 2014 – the Blob grows and upwelling slows; species shift north to cooler waters; many sea lion strandings
- 2015 – warm Blob envelopes the west coast and El Niño develops causing krill and forage fish declines; harmful algal blooms; large whale unusual mortality event
- 2016 – west coast waters cool but still shifts in the food web; pyrosomes multiply at levels never seen before; seabird die off
- 2017 – cooling conditions return while the Arctic remains warm; krill and anchovy increases; air temperatures warm; snowpack increases
The Blob with El Niño was a “climate stress test” and harbinger of what may lie ahead due to a changing climate.
Drawing of a pump in a crop area with groundwater flowing from the faucet. Our ability to adapt management of freshwater resources to protect freshwater biodiversity is a greater threat than the expected changes in temperature and precipitation due to climate change.
Drawing of snowpack runoff flowing down a mountain that runs into a dam. Decreased flow is one of the greatest impacts to freshwater biodiversity.
Drawing of two exotic desert birds and below ground two small desert rodent-like mammals. Birds and mammals are having different responses to climate change, especially extremes in drying and lack of precipitation. While mammals are relatively stable, many bird species are experiencing community collapse. Daily cooling costs for birds are three times higher than for mammals, who are typically nocturnal and less affected by daytime temperatures.
Drawing of three insects that are prey for the birds. Much of the water that birds get comes through their food, which is affected by high temperatures and lack of precipitation.
Climate change doesn’t just add new challenges but compounds our challenges with past and current water management and human modifications to landscape.
Indicators of Climate Change in California
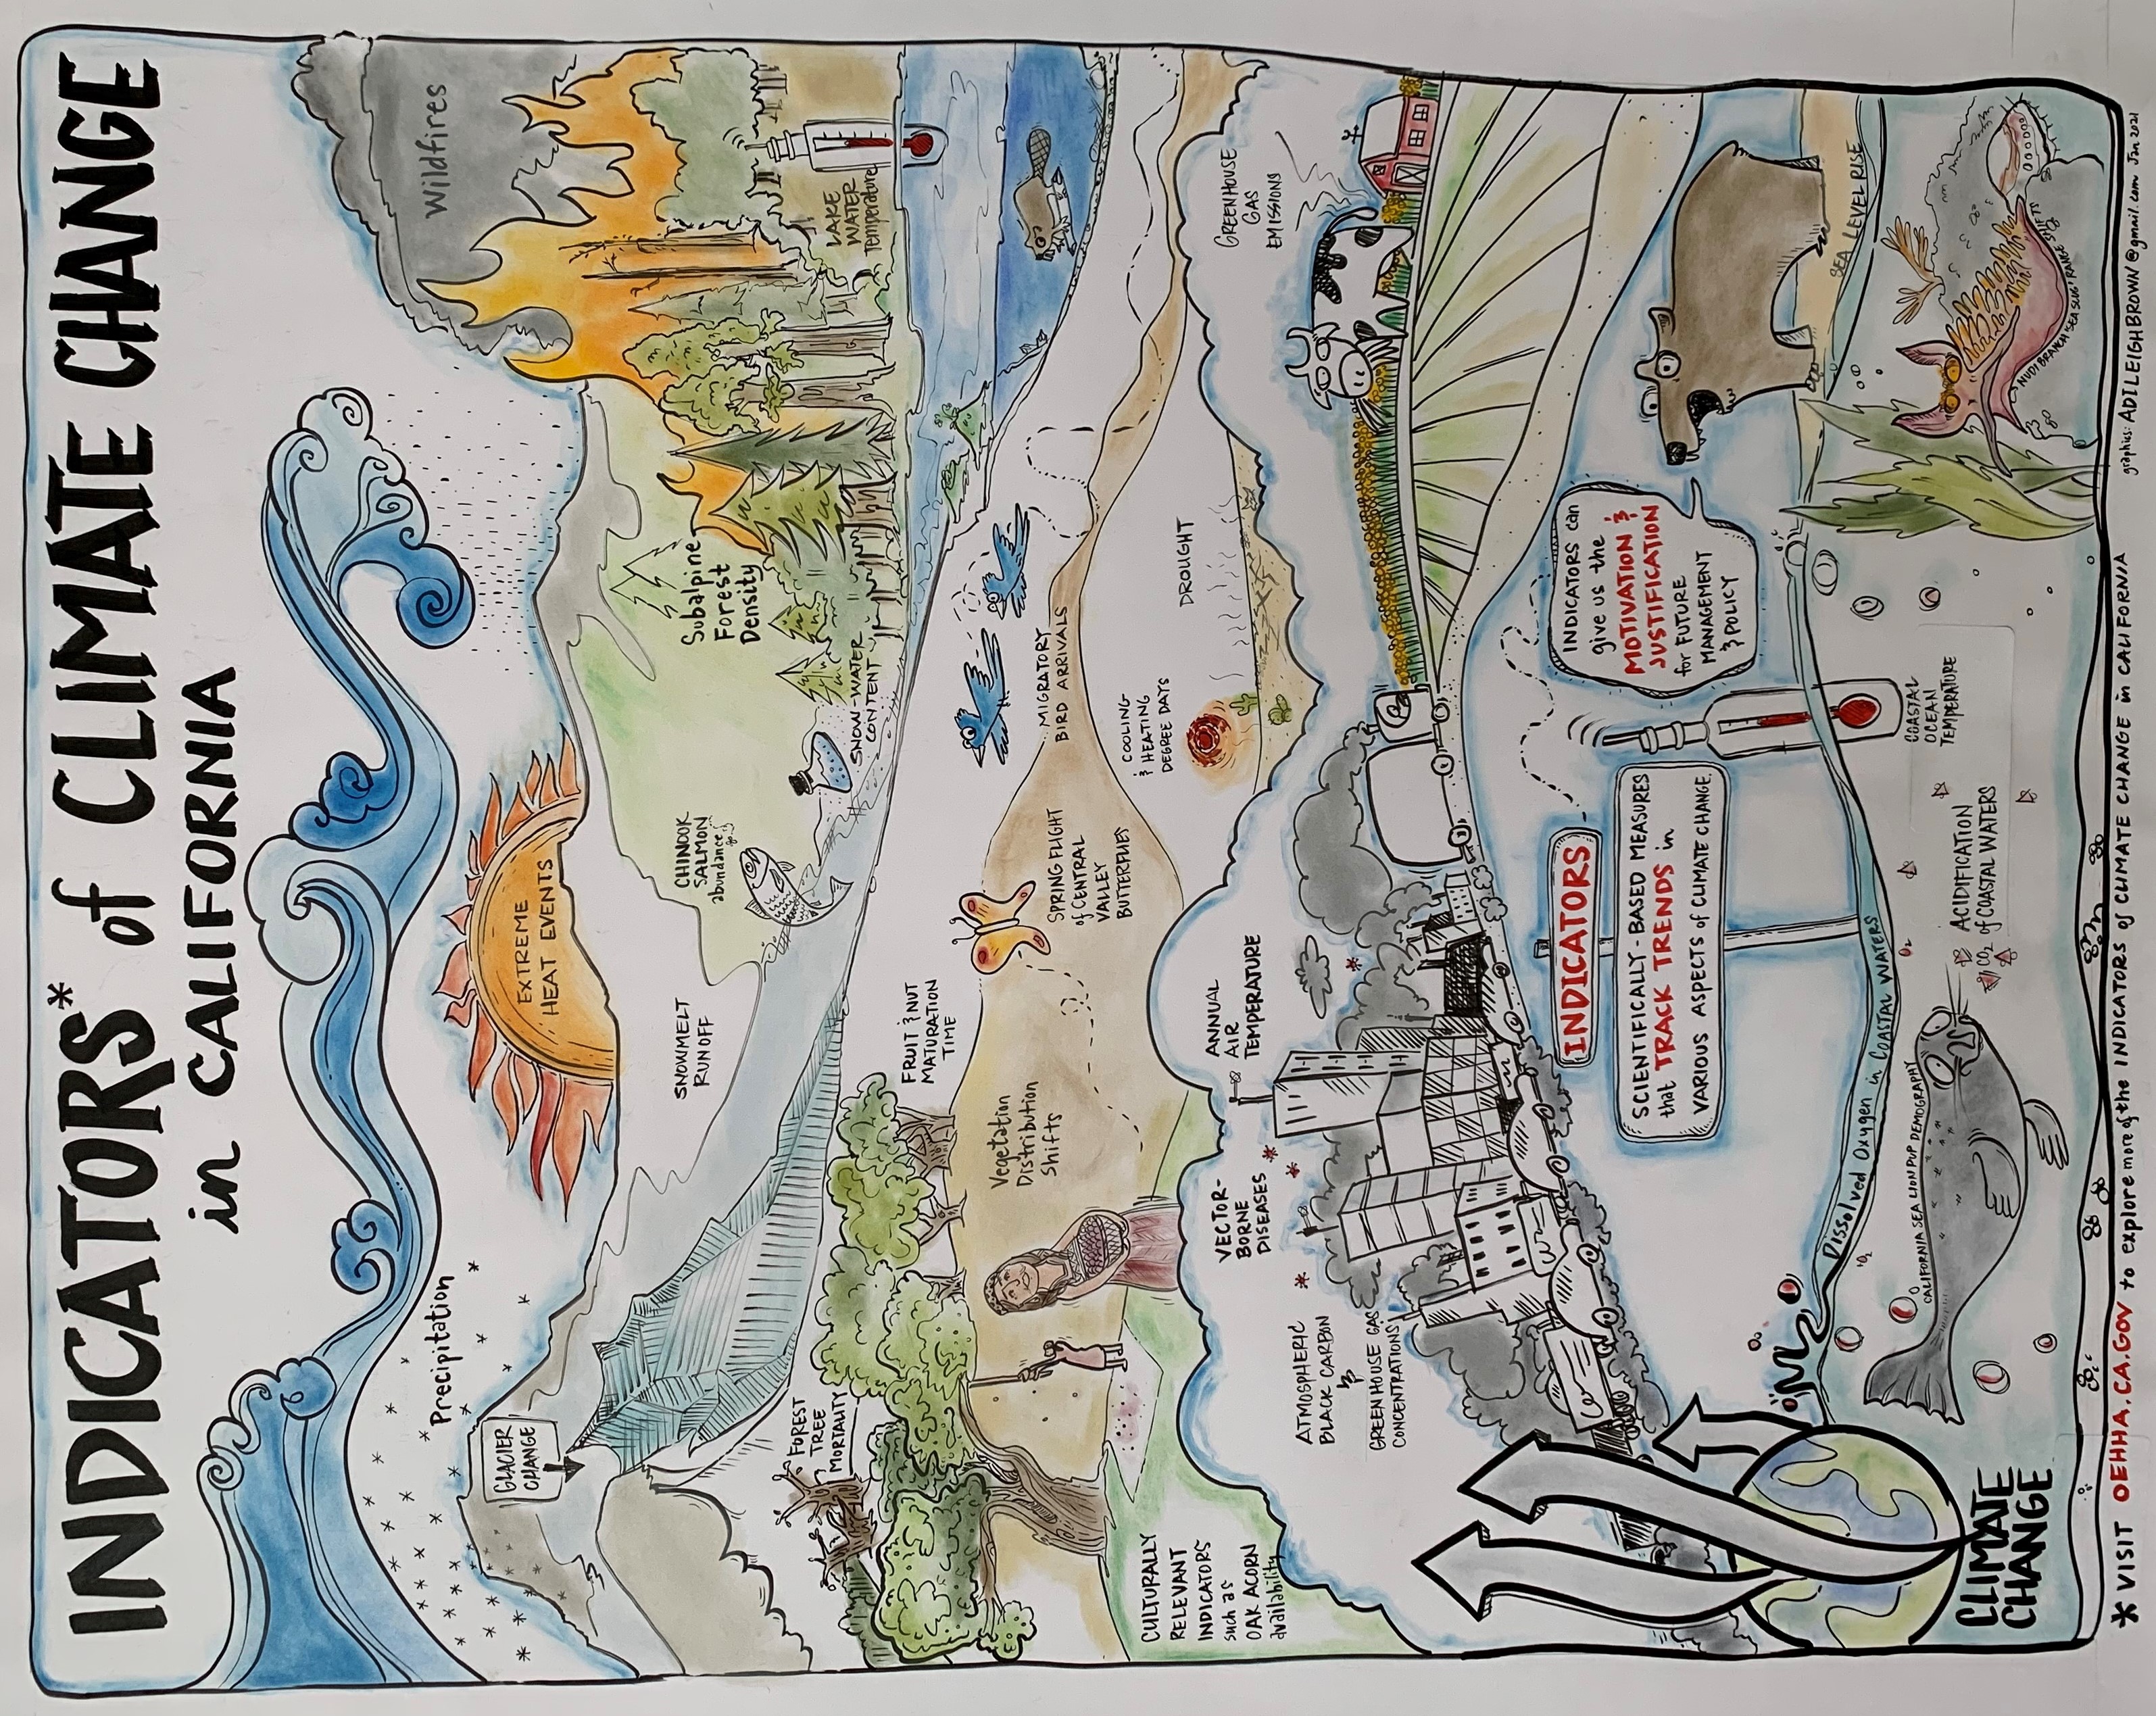
Poster Indicators of Climate Change in California
A main theme is rare events are becoming commonplace.
The world is continuing to warm and we are leaving historical distributions behind and carving out new climate territory.
A large wave of water flows across the poster. Atmospheric rivers are flowing columns of water vapor that can be 250 to 375 miles wide and produce significant levels of rain and snow.
Drawing of mountains, heavy rain, runoff and forest fire. We are in a unique time of concurrent flooding and drought. One extreme can lead to cascading effect of flood following fire following drought. We need to consider how we manage reservoirs to buffer atmospheric river events.

